At a Glance
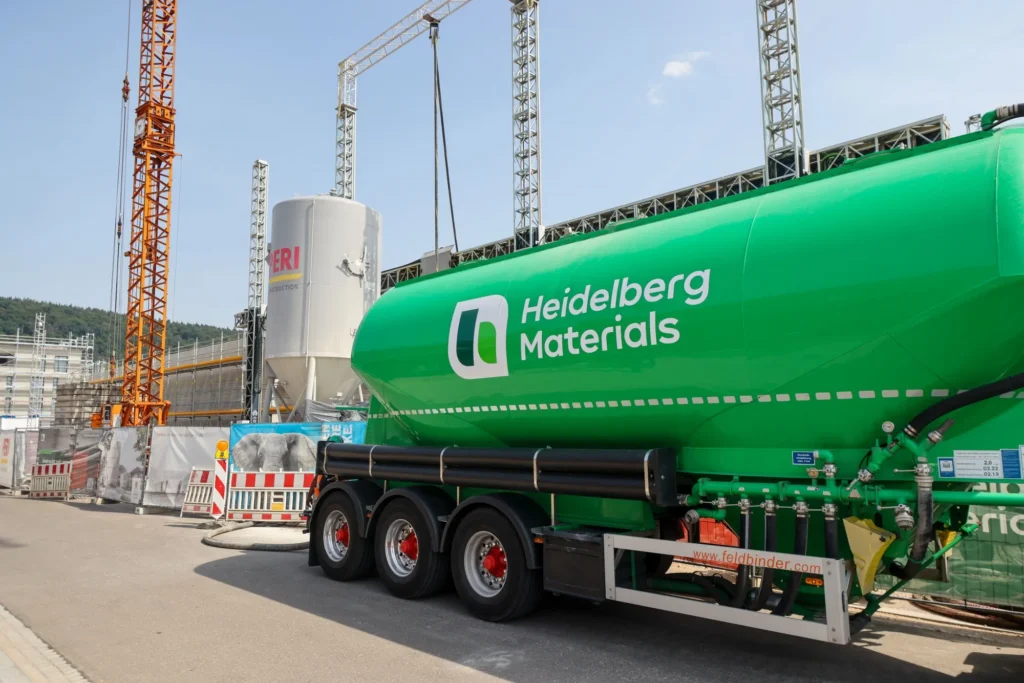
HeidelbergCement India (MyCem’s proud parent) delivered a surprisingly strong Q1 FY26. Revenue grew 12% YoY to ₹598 Cr, while PAT jumped 21% to ₹48 Cr. Margins rebounded to 15% after a rocky FY25. The stock rallied 3.5% to ₹218, boasting a healthy 3.67% dividend yield. Still, with flat sales growth over five years and a P/E of 43, it’s like paying luxury prices for regular cement – strong, but pricey.
1. Introduction
Cement companies usually thrive on government capex and housing booms. Heidelberg India, however, adds its German efficiency twist – low debt, high dividends, and an obsession with green energy. Despite muted long-term sales, the company keeps profits flowing like wet concrete.
2. Business Model (WTF Do They Even Do?)
- Core Business: Production & sale of 100% blended cement under MyCem and MyCem Power brands.
- Plants: Damoh (MP), Jhansi (UP), Ammasandra (Karnataka).
- Green Push: 33% increase in green power generation; alternate fuel usage at 6%.
- Revenue Drivers: Mostly from domestic construction and infrastructure.
3. Financials Overview
Q1 FY26 Snapshot:
- Revenue: ₹598 Cr (+12% YoY)
- EBITDA: ₹89 Cr (OPM 15%)
- PAT: ₹48 Cr (+21% YoY)
- EPS: ₹2.13
FY25 Recap:
- Revenue: ₹2,149 Cr
- PAT: ₹107 Cr
- EPS: ₹4.71
Growth is back on track after a profit slump in FY24.
4. Valuation
- P/E: 42.9 – expensive vs peers like ACC (14.7).
- P/B: 3.54 – premium over book.
- EV/EBITDA: ~12x – slightly stretched.
Fair Value Range: ₹180–₹210, given the slow growth but strong dividends.
5. What’s Cooking – News, Triggers, Drama
- MD Joydeep Mukherjee reappointed for 3 more years.
- Dividend Yield at a juicy 3.7% keeps income investors smiling.
- Green Energy Investments to cut costs & emissions.
- Threat: Sales growth remains sluggish (-0.2% CAGR over 5 years).
6. Balance Sheet
| (₹ Cr) | FY23 | FY24 | FY25 |
|---|---|---|---|
| Assets | 2,665 | 2,661 | 2,542 |
| Liabilities | 1,430 | 1,191 | 1,146 |
| Net Worth | 1,462 | 1,470 | 1,396 |
| Borrowings | 182 | 137 | 75 |
Remark: Almost debt-free – a cement stock without leverage drama.
7. Cash Flow – Sab Number Game Hai
| (₹ Cr) | FY23 | FY24 | FY25 |
|---|---|---|---|
| Operating | 226 | 350 | 265 |
| Investing | 144 | -48 | -73 |
| Financing | -267 | -242 | -271 |
Comment: Consistent cash from ops, aggressive debt repayment.
8. Ratios – Sexy or Stressy?
| Ratio | FY23 | FY24 | FY25 |
|---|---|---|---|
| ROE | 7% | 7.4% | 7.5% |
| ROCE | 11% | 16% | 11% |
| PAT Margin | 4.4% | 7% | 5% |
| D/E | 0.12 | 0.09 | 0.05 |
Verdict: Low leverage, but low returns – safe yet slow.
9. P&L Breakdown – Show Me the Money
| (₹ Cr) | FY23 | FY24 | FY25 |
|---|---|---|---|
| Revenue | 2,238 | 2,366 | 2,149 |
| EBITDA | 249 | 317 | 239 |
| PAT | 99 | 168 | 107 |
Remark: FY25 was a dip; FY26 starting to recover.
10. Peer Comparison
| Company | Revenue (₹ Cr) | PAT (₹ Cr) | P/E |
|---|---|---|---|
| UltraTech | 77,752 | 6,911 | 52 |
| Shree Cement | 19,283 | 1,118 | 98 |
| ACC | 22,743 | 2,335 | 14.7 |
| Heidelberg India | 2,214 | 115 | 42.9 |
Verdict: Valued like a premium player despite being small.
11. Miscellaneous – Shareholding, Promoters
- Promoter Holding: 69.4% (HeidelbergCement Group)
- FIIs: 1.35% (falling)
- DIIs: 13.9% (rising)
- Public: 15.1%
12. EduInvesting Verdict™
HeidelbergCement India is the disciplined German kid in a class full of reckless cement players. Debt-free, dividend-paying, but growth is as slow as a cement truck stuck in traffic. With green energy push and cost efficiency, margins should improve, but topline growth remains the missing link.
SWOT Analysis
- Strengths: Strong parentage, clean balance sheet, dividends.
- Weaknesses: Sluggish revenue, low ROE.
- Opportunities: Infra boom, sustainability initiatives.
- Threats: Price wars, demand cyclicality.
For investors, it’s a safe parking space – not a racing car.
Written by EduInvesting Team | 29 July 2025
SEO Tags: HeidelbergCement India, Q1 FY26, Cement Stocks, MyCem

