At a Glance
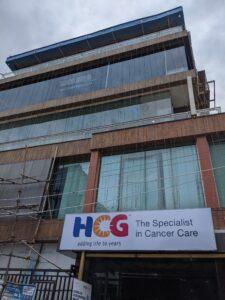
Healthcare Global (HCG) managed to grow revenue to ₹613 Cr (+16.7% YoY), but net profit fell 61% YoY to just ₹6 Cr. The P/E? A nosebleed 234x, proving investors love burning cash as much as HCG burns margins. Promoter holding dropped 9% (ouch), and the cancelled earnings call says more than the numbers. For now, HCG is still India’s top private cancer care network, but financially, it’s showing symptoms.
Introduction
If hospitals treat patients, who treats the hospital’s financials? HCG’s Q1 FY26 looks like a patient on observation: stable top line, but weak bottom line. Margins held at 17.5%, but interest and depreciation ate profits alive. With promoter selling and no dividends, retail investors might need therapy more than oncology.
Business Model (WTF Do They Even Do?)
- Cancer Care (Core): 26+ private cancer hospitals, largest network in India.
- Fertility (Milann): IVF and reproductive treatments.
- Diagnostics & Consulting: Ancillary services adding to revenue mix.
Model is capex-heavy, with long payback periods, so cash burns faster than chemotherapy cycles.
Financials Overview
Q1 FY26 Snapshot:
- Revenue: ₹613 Cr
- Operating Profit: ₹108 Cr
- OPM: 17.6%
- Net Profit: ₹6 Cr
- EPS: ₹0.34
FY25 Recap:
- Revenue: ₹2,223 Cr
- PAT: ₹49 Cr
- EPS: ₹3.19
- Margins decent but leveraged balance sheet hurts.
Commentary: Growth is healthy, profitability is not.
Valuation
1. P/E Method
- EPS (FY25): ₹3.19
- CMP ₹612 → P/E: 192x (Q1 loss makes it worse)
2. EV/EBITDA
- FY25 EBITDA ≈ ₹387 Cr
- EV ≈ ₹8,539 Cr + Debt ₹1,837 Cr → ₹10,376 Cr
- EV/EBITDA ≈ 27x
3. DCF (Quick & Dirty)
- Given high capex and low ROE, fair value ≈ ₹350–₹450.
Verdict: Overvalued with weak profit visibility.
What’s Cooking – News, Triggers, Drama
- Promoter Sell-off: Stake fell to 62.46%.
- Capex Expansion: Adding new cancer care units (costs high).
- Earnings Call Cancelled: Not a great sign for investor confidence.
- Zero Dividend: Investors get love, not cash.
Balance Sheet – Not Terminal, But Weak
| Assets | ₹ Cr |
|---|---|
| Total Assets | 3,543 |
| Fixed Assets | 2,442 |
| Other Assets | 1,065 |
| Liabilities | ₹ Cr |
|---|---|
| Borrowings | 1,837 |
| Other Liabilities | 784 |
| Net Worth | 922 |
Remark: Leverage high, returns low.
Cash Flow – Sab Number Game Hai
| Year | Ops (₹ Cr) | Investing (₹ Cr) | Financing (₹ Cr) |
|---|---|---|---|
| FY23 | 252 | -133 | -140 |
| FY24 | 285 | -226 | -64 |
| FY25 | 317 | -488 | -42 |
Remark: Operations generate cash, capex eats it all.
Ratios – Sexy or Stressy?
| Metric | Value |
|---|---|
| ROE | 5.08% |
| ROCE | 8.52% |
| P/E | 234x |
| PAT Margin | 1% |
| D/E | 2.0x |
Remark: Ratios scream “growth stock” but with a debt hangover.
P&L Breakdown – Show Me the Money
| Year | Revenue ₹ Cr | EBITDA ₹ Cr | PAT ₹ Cr |
|---|---|---|---|
| FY23 | 1,691 | 297 | 18 |
| FY24 | 1,908 | 327 | 41 |
| FY25 | 2,223 | 387 | 49 |
| TTM | 2,310 | 404 | 41 |
Remark: Growth yes, profit no.
Peer Comparison
| Company | Rev (₹ Cr) | PAT (₹ Cr) | P/E |
|---|---|---|---|
| Max Healthcare | 7,028 | 1,132 | 107x |
| Apollo Hospitals | 21,794 | 1,446 | 73x |
| Narayana Hrudaya | 5,483 | 796 | 50x |
| HCG | 2,310 | 41 | 234x |
Remark: Highest P/E, weakest profit.
Miscellaneous – Shareholding, Promoters
- Promoters: 62.46% (down from 71%)
- FIIs: 2.16%
- DIIs: 13.22%
- Public share jumps – retail taking the risk.
EduInvesting Verdict™
Healthcare Global Enterprises is India’s oncology leader operationally, but financially it’s overstretched. With a P/E north of 200 and shrinking profits, it’s priced for perfection. Promoter selling adds pressure, while debt-fueled expansion keeps cash flows tight.
SWOT
- Strengths: Largest cancer network, strong brand.
- Weaknesses: High P/E, low ROE, debt-heavy.
- Opportunities: Expanding cancer care demand.
- Threats: Rising competition, cost overruns.
Final Word:
HCG is a growth story on crutches. Unless profits catch up with valuations, investors risk chemotherapy-level pain.
Written by EduInvesting Team | 01 Aug 2025
SEO Tags
Healthcare Global, HCG Oncology, Q1 FY26 Results, Hospital Stocks, Overvalued Healthcare


