1. At a Glance
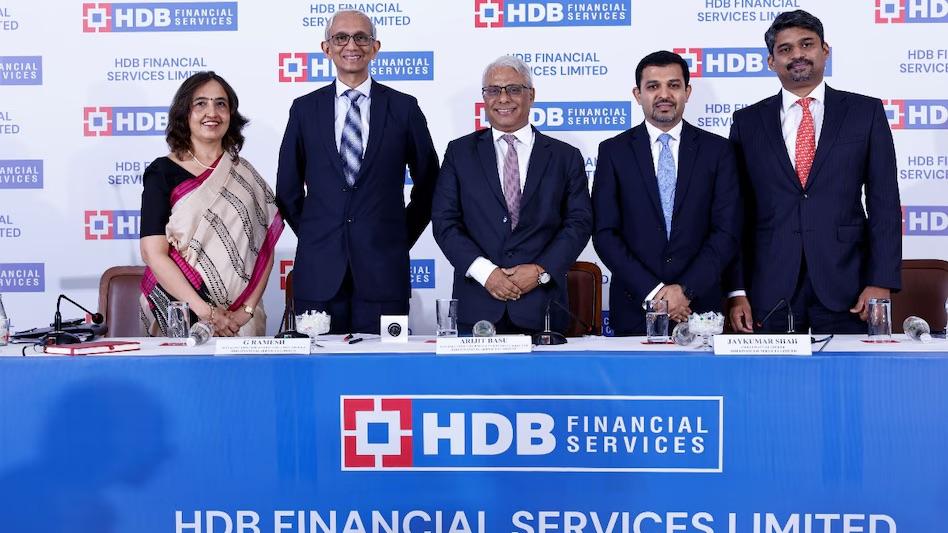
With 1,771 branches across 1,170 cities, HDB Financial Services Ltd is HDFC Bank’s not-so-secret NBFC cousin. It lends money, sells insurance, does collections and BPO, and just dropped a ₹12,500 Cr IPO mic.
2. Introduction with Hook
Imagine a loan shark, a call center, and an insurance agent walk into a boardroom—boom, HDB Financial Services is born.
- Q1 FY26 PAT: ₹568 Cr (YoY up from ₹531 Cr in Q4 FY25)
- AUM: ₹1.09 Lakh Cr, up 14.7% YoY
- But here’s the drama: Stage 3 loans jumped to 2.56%—the NBFC version of a stress rash.
3. Business Model (WTF Do They Even Do?)
HDB Financial is an NBFC but also doubles as a BPO for HDFC Bank. Here’s the breakdown:
- Lending Biz: Vehicle loans, personal loans, gold loans, enterprise financing.
- Insurance Distributor: For HDFC Life and HDFC Ergo.
- BPO Ops: Call centers, collections, back-office for HDFC Bank.
- So yes, they make money from interest… and also when you scream at a call center agent.
4. Financials Overview
Let’s take a ₹ ride.
| Metric | FY21 | FY22 | FY23 | FY24 | FY25 |
|---|---|---|---|---|---|
| Revenue (₹ Cr) | 10,945 | 11,312 | 12,403 | 14,173 | 16,300 |
| Net Profit (₹ Cr) | 391 | 1,011 | 1,959 | 2,461 | 2,176 |
| OPM % | 41% | 42% | 50% | 59% | 59% |
| ROE % | – | 11% | 17% | 17% | 15% |
- ROE dipped slightly as provisions increased.
- OPM looks cushy, but interest cost is creeping up like EMI on a used iPhone.
5. Valuation
HDB trades at ₹841 with a market cap of ₹69,721 Cr.
Peer avg P/E = 29.4x | HDB’s P/E = 32x
Let’s calculate a Fair Value Range:
Method 1: PE-based
- EPS FY25 = ₹27.3
- FV Range = ₹27.3 × (25–35) = ₹682 – ₹955
Method 2: P/BV-based
- BV = ~₹390
- Avg NBFC P/BV = 2.0–2.5
- FV Range = ₹780 – ₹975
🎯 EduInvesting FV Range: ₹700 – ₹960
It’s not a steal, but it’s not kidney-selling expensive either.
6. What’s Cooking – News, Triggers, Drama
- IPO raised ₹12,500 Cr in Apr–May 2025.
- IPO hype fizzled faster than your New Year’s resolution.
- Stage 3 loans (NPA) crept up from 2.2% → 2.56%.
- Concall hinted at focus on MSME + consumer durable loans.
- Rating stable, but CRISIL watching like a strict tuition teacher.
7. Balance Sheet
| Year | Equity | Reserves | Borrowings | Total Assets |
|---|---|---|---|---|
| FY21 | ₹789 Cr | ₹7,657 Cr | ₹50,359 Cr | ₹62,641 Cr |
| FY25 | ₹796 Cr | ₹15,024 Cr | ₹87,398 Cr | ₹1,08,663 Cr |
Key Points:
- Borrowings ballooned by 73% in 4 years.
- But reserves doubled too—so not all carbs.
- Solid asset growth, but liabilities sweating a bit.
8. Cash Flow – Sab Number Game Hai
| Year | CFO | CFI | CFF | Net Cash Flow |
|---|---|---|---|---|
| FY21 | -342 | 131 | 608 | 398 |
| FY25 | -13,626 | 1,159 | 12,770 | 303 |
Highlights:
- Negative cash flow from ops = red flag
- Heavy reliance on financing = not great if capital dries
- Investing cashflows show steady asset building
9. Ratios – Sexy or Stressy?
| Ratio | FY21 | FY22 | FY23 | FY24 | FY25 |
|---|---|---|---|---|---|
| ROCE % | – | 8% | 10% | 11% | 10% |
| ROE % | – | 11% | 17% | 17% | 15% |
| Debtor Days | 4 | 5 | 2 | 3 | 5 |
| Working Capital Days | -114 | -94 | -99 | -108 | -107 |
- Decent ROEs, but declining.
- Negative working capital is typical for NBFCs.
- Debtor days rising = collection hustle incoming.
10. P&L Breakdown – Show Me the Money
| Year | Sales | Expenses | EBITDA | Net Profit |
|---|---|---|---|---|
| FY25 | ₹16,300 Cr | ₹6,745 Cr | ₹9,555 Cr | ₹2,176 Cr |
- High operating margin (59%) = strong biz fundamentals
- But interest eats away profits
- EBITDA = fat, but PAT = diet version
11. Peer Comparison
| Company | Price | P/E | ROE % | AUM (Est) | PAT (FY25) |
|---|---|---|---|---|---|
| Bajaj Finance | ₹928 | 34.6 | 19.2 | ₹3.0 L Cr | ₹4,480 Cr |
| Shriram Finance | ₹684 | 15.6 | 15.6 | ₹1.9 L Cr | ₹2,140 Cr |
| Muthoot Finance | ₹2,655 | 19.9 | 19.6 | ₹0.75 L Cr | ₹1,443 Cr |
| HDB Financial | ₹841 | 32.0 | 14.7 | ₹1.09 L Cr | ₹2,176 Cr |
- HDB is still a midweight NBFC.
- ROE and P/E tell us it’s priced more like a premium than a bargain.
12. Miscellaneous – Shareholding, Promoters
| Category | Share % |
|---|---|
| Promoter (HDFC Bank) | 74.19% |
| FIIs | 4.11% |
| DIIs | 5.16% |
| Public | 16.3% |
- Retail holds only 16.3%
- Fully under HDFC Bank’s thumb (aka comfort zone for rating agencies)
13. EduInvesting Verdict™
HDB Financial Services is like the nerdy cousin of Bajaj Finance—less flashy, more obedient, and tied to Papa HDFC. While the financials are decent and growth stable, risks around rising NPAs, interest cost, and negative CFO cannot be ignored. It’s not too hot, not too cold—Goldilocks zone, but depends if you trust the big daddy HDFC to keep it afloat during a down cycle.
Metadata
– Written by EduInvesting Analyst | 15 July 2025
– Tags: HDB Financial Services, NBFCs, HDFC Group, IPO Watch, Q1 FY26, Lending, Financial Stocks, EduInvesting Style, Sarcasm-Infused Research
