General information and entertainment, not investment advice. The author is not a SEBI-registered adviser or research analyst. No recommendation, no promised returns. Markets carry risk including loss of capital. Figures may not be current. Consult a registered adviser before acting.
1 — At a Glance
HB Estate Developers closed FY26 with sales of ₹116.93 Cr — almost exactly the ₹116.49 Cr it booked the year before, a 0.38% nudge that registers as a rounding error rather than growth. Net profit landed at ₹11.7 Cr against ₹10.79 Cr, the company’s third consecutive profitable year after a long stretch where the bottom line lived underwater.
The attention-grabber sits below the revenue line. Operating profit held at roughly ₹41 Cr on a 35% operating margin, yet interest of ₹16.5 Cr still claimed a large slice of what the hotel earned. The worry sits beside it: borrowings of ₹257.91 Cr against a net worth of ₹193.61 Cr, a debt-to-equity of 1.33, and a return on equity of 6.36% that struggles to justify the balance sheet carrying it.
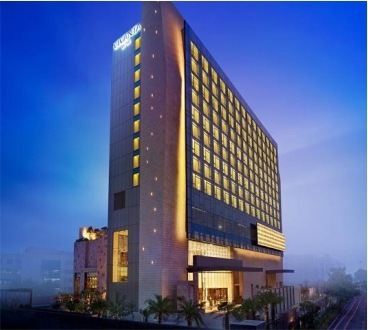
A single hotel asset — the Taj City Centre in Gurugram — generates this entire record. The company runs one reportable segment, hospitality, and consolidates one associate.
A profitable company whose interest line has historically rivalled its operating profit is a study in how much a balance sheet can decide before operations get a vote. The market currently pays about 15x earnings here, against a peer median near 27x.
Whether the debt reduction underway continues, or the margin holds, is the question the next few years will answer.
2 — Introduction
Incorporated in 1994, HB Estate Developers is in the business of owning and managing hotels and real estate properties. In practice, the operating story is a single property: the Taj City Centre in Gurugram, run under management with the company holding the asset.
The recent corporate history is dominated by capital raising rather than expansion. In April 2024 the company allotted 35 lakh convertible warrants on a preferential basis — 20 lakh (Warrant A) at ₹65.25 to the promoter group, and 15 lakh (Warrant B) at ₹65.25, aggregating ₹9.79 Cr, to the non-promoter category. The promoter warrants converted into equity during FY25. The non-promoter warrants converted in two tranches during FY26: 7.5 lakh shares in July 2025 and 7.5 lakh in October 2025.
The company has stated the ₹22.84 Cr raised across these objects went mostly to long-term working capital (₹18.27 Cr) and general corporate purposes (₹4.57 Cr). The associate, Parsvnath HB Projects Pvt. Ltd (49% held), sits in the consolidation; the company has extended it a loan of ₹3.15 Cr including accrued interest.
The board, chaired by Lalit Bhasin, approved FY26 audited results on May 29, 2026, with auditors N.C. Aggarwal & Co. issuing an unmodified opinion.
3 — Business Model: WTF Do They Even Do?
Strip away the “Estate Developers” in the name and you find a company that develops very little estate and runs one hotel quite consistently. The FY25 revenue breakup tells the honest story: hotel rooms at about 63%, food and beverage, restaurant and banquet income at roughly 32%, and everything else under 5%. This is a hospitality business wearing a real-estate company’s letterhead.
The asset base reflects it. Net block stood at ₹397.85 Cr in FY26 — overwhelmingly the hotel property — against total assets of ₹490.98 Cr. Investments are a rounding-error ₹2.06 Cr. There is no capital work in progress, no second hotel rising somewhere, no pipeline of keys. What the company owns, it has owned; the model is to operate the asset it has rather than build new ones.
That makes the financial shape easy to describe: a fixed, depreciating, debt-financed asset that throws off a respectable operating margin, with the entire question of profitability resting on how much interest the financing structure demands each year. Revenue has crept from ₹95.42 Cr (FY23) to ₹116.93 Cr (FY26), a recovery from the FY21 collapse to ₹24.23 Cr when the hotel business simply stopped.
Headcount underlines the single-asset reality — the company reports a handful of corporate-roll employees, with the hotel unit carrying the operational staff. One hotel, one segment, one story.
Does a 35% operating margin matter when one asset and one financing structure write the whole script?
4 — Financials Overview
Figures are consolidated, in ₹ crore. Latest period is the quarter ended March 2026.
| Metric | Q4 FY26 | YoY (Q4 FY25) | QoQ (Q3 FY26) |
|---|---|---|---|
| Revenue | 32.97 | 33.23 | 33.46 |
| Operating Profit | 10.86 | 13.26 | 15.24 |
| PAT | 3.55 | 4.58 | 6.50 |
| EPS (₹) | 1.55 | 2.13 | 2.83 |
The March quarter softened on both comparisons. Revenue eased 0.78% year-on-year and slipped from the December quarter. Operating profit fell to ₹10.86 Cr from ₹15.24 Cr in the prior quarter, and the operating margin compressed to 32.94% from 45.55% — the figures sit on the data sheet. PAT of ₹3.55 Cr was down 22.5% year-on-year.
For the full year, sales of ₹116.93 Cr produced PAT of ₹11.7 Cr and full-year EPS of ₹5.10. The interest line did the heavy lifting on the improvement: finance costs fell to ₹16.5 Cr in FY26 from ₹21.82 Cr in FY25, and that ₹5.3 Cr saving runs straight toward the bottom line.

Filing note. The standalone results carry a provision of ₹36.24 Lakhs toward gratuity and leave encashment under employee benefit expense, which the company attributed to the incremental impact of the new Labour Codes recognised this year.
5 — Market Expectations & Historical Multiples
This section describes how the market is currently pricing the company and how that compares with its own history and peer group. It is descriptive, not predictive.
| Metric | Current | Historical Average | Peer Median |
|---|---|---|---|
| P/E | ~15x | — | 26.5x |
| P/B | 0.90x | — | — |
| ROE | 6.36% | — | — |
| ROCE | 7.53% | 8% (5-yr) | 8.04% |
The market currently pays about 15x earnings here versus a peer median near 27x, and prices the equity at 0.90x book versus a stated book value of ₹84.3. The realty peer set — DLF, Lodha, Oberoi, Godrej Properties and others — carries multiples in the high-20s to 50s on far larger revenue and PAT bases.
What the market appears to be pricing in is the gap between this company and its peers on the metrics that drive valuation: an ROE of 6.36% and ROCE of 7.53% sit below the peer median return profile, and a debt-to-equity of 1.33 sits over a single-asset operation rather than a diversified development pipeline. A multiple below book and below the peer set reflects a return profile that has not yet matched the sector, not a forecast of where it goes.
One factual observation on market expectations: the company trades at roughly half the peer median P/E while its ROCE sits roughly in line with that peer median.
6 — What’s Cooking
The material events of FY26 are mostly about the cap table, not the hotel.
The Warrant B conversions completed during the year: 7.5 lakh equity shares were allotted in July 2025 and another 7.5 lakh in October 2025, both at ₹65.25, lifting paid-up capital to ₹23.23 Cr. BSE granted trading approval for the October tranche in December 2025. The total ₹9.79 Cr raised against Warrant B has been deployed for its stated objects.
On governance housekeeping, the board re-appointed M/s Marv & Associates LLP as internal auditor for FY27, and statutory auditors N.C. Aggarwal & Co. signed off the FY26 results with an unmodified opinion.
These are real events, reported at their stated sizes — a capital structure finishing a planned conversion and an audit closing clean.
7 — Balance Sheet
| Item (₹ Cr) | FY24 | FY25 | FY26 |
|---|---|---|---|
| Total Assets | 494.16 | 496.35 | 490.98 |
| Net Worth | 149.15 | 174.53 | 193.61 |
| Borrowings | 311.11 | 284.14 | 257.91 |
| Other Liabilities | 33.90 | 37.68 | 39.46 |
| Total Liabilities | 494.16 | 496.35 | 490.98 |
Assets equal liabilities in every column — the ledger balances.
- Borrowings spent the year quietly losing weight, falling from ₹311.11 Cr (FY24) to ₹257.91 Cr (FY26) — about ₹53 Cr off in two years, and ₹89 Cr off since the FY22 peak of ₹346.79 Cr.
- Net worth climbed to ₹193.61 Cr, helped both by retained profit and by ₹9.79 Cr of fresh warrant equity — some of the improvement was bought rather than earned.
- The asset side barely moved: net block of ₹397.85 Cr is the same hotel, depreciating on schedule, with no capital work in progress behind it.
Debt is still larger than equity at a 1.33 ratio, but the direction over three years has been toward equity. Cash and bank stood at ₹26.73 Cr against borrowings of ₹257.91 Cr — a net debt position near ₹231 Cr.
A balance sheet improving by both paying down debt and issuing shares is improving twice over, and only one of those is free.
8 — Cash Flow: Sab Number Game Hai
| Year | Operating | Investing | Financing |
|---|---|---|---|
| FY24 | 48.51 | -1.17 | -44.97 |
| FY25 | 34.71 | -3.97 | -32.44 |
| FY26 | 45.47 | -0.93 | -35.92 |
The pattern is consistent and tells the whole financing story. Operating cash flow of ₹45.47 Cr in FY26 is strong against PAT of ₹11.7 Cr — depreciation of ₹7.98 Cr and the working-capital profile widen the gap. Investing activity is near zero, as expected for a company building nothing. And financing is a steady outflow of ₹35.92 Cr, which is the debt being serviced and repaid year after year.
For three running years, the hotel has generated cash and the financing line has carried most of it back out to lenders. That is the model in one table: operations feed the debt.
When operating cash flow is four times reported profit, the depreciation on a single large asset is doing visible work in the gap.
9 — Ratios: Sexy or Stressy?
| Ratio | Value |
|---|---|
| ROE | 6.36% |
| ROCE | 7.53% |
| P/E | ~15x |
| PAT Margin | 10.0% |
| D/E | 1.33 |
ROE of 6.36% means the equity is working part-time — the returns the business generates sit below what the asset base and leverage would suggest is comfortable. ROCE of 7.53% says the same in capital-employed terms: the company earns a single-digit return on everything financing the hotel. The PAT margin of 10% is the residue after interest claims its share of a 35% operating margin — the distance between those two numbers is the financing cost. D/E of 1.33 keeps the balance sheet on the leveraged side, even after the borrowings reduction. Interest coverage of 2.08 means operating earnings cover finance costs twice over — improved, but not loosely.
10 — P&L Breakdown: Show Me the Money
| Year | Revenue | Operating Profit | Other Income | PAT | EPS (₹) |
|---|---|---|---|---|---|
| FY24 | 108.41 | 39 | 1.78 | 3.89 | 2.00 |
| FY25 | 116.49 | 43 | 2.36 | 10.79 | 5.03 |
| FY26 | 116.93 | 41 | 1.53 | 11.7 | 5.10 |
The honest column here is Other Income, and it behaves well: at ₹1.53 Cr against operating profit of ₹41 Cr, almost none of FY26’s profit is non-operating. This is a real-business result, not one rescued by treasury gains or one-offs — the hotel earned what shows up.
The trajectory anchored on operating profit and PAT shows a company that recovered revenue to the ₹116 Cr level and then plateaued, while PAT rose from ₹3.89 Cr to ₹11.7 Cr largely because interest fell, not because the top line grew. Operating profit itself sits in a narrow ₹39–43 Cr band across all three years.
EPS guard: PAT rose from ₹10.79 Cr to ₹11.7 Cr while EPS moved only from ₹5.03 to ₹5.10 — the muted EPS gain is the share count, which expanded through the Warrant B conversions during FY26, not a profit stall. The denominator grew almost as fast as the numerator.
11 — Peer Comparison
| Company | Revenue Qtr (₹ Cr) | PAT Qtr (₹ Cr) | P/E |
|---|---|---|---|
| DLF | 1,814.06 | 1,268.56 | 35.93 |
| Lodha Developers | 4,713.50 | 1,008.10 | 27.37 |
| Oberoi Realty | 1,749.83 | 703.28 | 26.07 |
| Godrej Properties | 3,458.13 | 645.44 | 29.55 |
| Anant Raj | 646.81 | 148.71 | 33.33 |
| HB Estate Devel. | 32.97 | 3.55 | 15.15 |
The size gap is the headline: HB Estate’s quarterly revenue of ₹32.97 Cr is a fraction of a percent of Lodha’s ₹4,713.50 Cr, and its ₹177 Cr market cap stands against peers measured in tens of thousands of crores. On the multiple, it trades at roughly half the peer median P/E. The peers here are diversified residential and commercial developers with active pipelines; HB Estate is a single-hotel operator filed under the same realty umbrella, which makes the multiple gap a comparison of two different business shapes more than two prices.
12 — Miscellaneous: Shareholding & Promoters
| Holder | % (Mar 2026) |
|---|---|
| Promoters | 67.42 |
| Institutions (DII) | 0.01 |
| Public | 32.56 |
Promoter holding fell from 71.98% (Mar 2025) to 67.42% (Mar 2026). The dilution traces to the non-promoter Warrant B conversions adding shares outside the promoter block — the promoters did not sell; the base grew around them. Lalit Bhasin remains the single largest holder at 47.75%, with H B Portfolio Limited at 9.17% and HB Stockholdings Limited at 4.90%.
The promoter group has run this single asset for years without diversifying it and without paying a dividend despite three profitable years — a posture of retention over distribution that the cash-flow table makes legible: the cash has gone to lenders, not shareholders. Institutional interest is effectively nil, with DII holding at 0.01%.
13 — Corporate Governance: Angels or Devils?
The governance picture is clean. Statutory auditors N.C. Aggarwal & Co. issued an unmodified opinion on both standalone and consolidated FY26 results. Pledged promoter shares stand at 0.00%. The board re-appointed its internal auditor for FY27 through a routine Regulation 30 disclosure.
The one substantive note is the new Labour Codes provision of ₹36.24 Lakhs recognised this year, which the company disclosed and quantified rather than buried. Contingent liabilities were stated at ₹1.08 Cr as of Mar 2025, down from ₹5.30 Cr a year earlier, including small property-tax and vacant-land-tax matters under dispute. These are flagged here as facts on the record, at the sizes disclosed.
the filings read as a small, audited, single-asset company doing its compliance.
14 — Industry Roast & Macro Context
Indian realty is a sector where “developer” covers everything from a 4,700-crore-quarter machine like Lodha to a one-hotel operator filed in the same bucket. The classification is generous: residential and commercial project builders sit beside a hospitality asset under the same “Realty” tag, which is how a ₹33 Cr quarterly revenue line ends up in a peer table next to four-figure ones.
Hospitality-within-realty carries its own physics. The asset is fixed and depreciating, the financing is heavy and front-loaded, and the margin lives or dies on occupancy and room rates the operator only partly controls. A single hotel concentrates every cyclical risk the broader sector spreads across a portfolio — the FY21 revenue collapse to ₹24 Cr is the scar that proves it. The new Labour Codes, made effective in May 2026, add a fresh compliance and cost layer for staff-heavy hotel operations across the industry. The sector rewards scale and pipeline; it has little patience for a balance sheet where one asset answers for everything.
15 — EduInvesting Verdict
| Strengths | Weaknesses |
|---|---|
| 35% operating margin; clean ₹1.53 Cr Other Income (real-business profit) | ROE 6.36%, ROCE 7.53% — single-digit returns on capital |
| Borrowings down ₹89 Cr from FY22 peak; OCF ₹45.47 Cr | D/E still 1.33; net debt ~₹231 Cr |
| Opportunities | Threats |
| Continued interest decline (₹21.82 Cr → ₹16.5 Cr) flowing to PAT | Single-asset concentration; FY21 collapse precedent |
| Three straight profitable years after a long loss run | Flat revenue (0.38% growth); no second asset in build |
HB Estate Developers ends FY26 as a company whose operations are sound and whose balance sheet is the entire plot. A 35% operating margin earned by one hotel is real, the debt is genuinely coming down, and the profit owes almost nothing to one-offs. Against that sits a return profile in the single digits, leverage above equity, and a top line that has stopped growing — the improvement in profit has come from the lenders charging less, not the hotel earning more.
A hotel that earns its margin honestly, sitting on a balance sheet still deciding how much of that margin it gets to keep.