1. At a Glance
Havells India, India’s beloved FMEG king, reported ₹5,455 Cr revenue and ₹348 Cr PAT in Q1 FY26. While topline grew 13% YoY, bottom-line dipped marginally QoQ—margins are behaving like voltage in rural India: fluctuating.
2. Introduction with Hook
Imagine a company that makes your fan, your switch, your geyser, and probably your Diwali lights too. That’s Havells.
But here’s the kicker:
- ROCE? A sizzling 25%
- FY26 Q1 PAT? ₹348 Cr
- Stock P/E? A spicy 68x
Yet despite leadership and a strong moat, margins aren’t exactly partying. So is this a pause or a pattern?
3. Business Model (WTF Do They Even Do?)
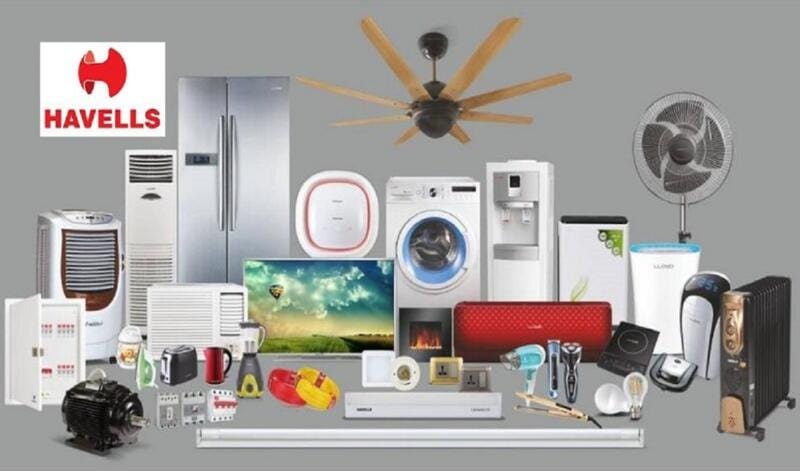
Havells is a full-stack FMEG and electrical brand, offering:
- Cables & Wires (~32% of revenue)
- Switchgears & Circuit Protection
- Fans, Lighting & Appliances
- Lloyd Brand (ACs, Refrigerators, TVs)
- Solar (New: ₹600 Cr in Goldi Solar Pvt Ltd)
The company controls the value chain—from manufacturing to retail—through a deep distributor network and retail presence across India.
4. Financials Overview
| Year | Revenue (₹ Cr) | PAT (₹ Cr) | EPS (₹) | OPM (%) |
|---|---|---|---|---|
| FY22 | 13,938 | 1,196 | 19.1 | 13% |
| FY23 | 16,911 | 1,072 | 17.1 | 10% |
| FY24 | 18,590 | 1,271 | 20.3 | 10% |
| FY25 | 21,778 | 1,470 | 23.5 | 10% |
| Q1 FY26 | 5,455 | 348 | 5.55 | 9% |
Margins are sticky—still sub-10% due to commodity inflation, Lloyd drag, and seasonality.
5. Valuation
| Metric | Value |
|---|---|
| CMP | ₹1,532 |
| EPS (TTM) | ₹22.5 |
| PE Ratio | 68.1x |
| Book Value | ₹133 |
| P/B Ratio | 11.5x |
| ROE | 18.8% |
EduInvesting FV Range (FY26 EPS ~₹26–28):
- Fair Valuation: ₹1,200–1,400 (based on P/E ~45–50x)
- Optimistic Range: ₹1,500–1,700
- Frothy/Overbought Zone: ₹1,800+
6. What’s Cooking – News, Triggers, Drama
Latest Buzz:
- ₹600 Cr invested in Goldi Solar Pvt Ltd – Solar vertical coming up?
- Q1 FY26 revenue up 13% YoY, but margin compressed YoY
- Investor call highlights: Lloyd business recovering slowly; capex being redirected toward renewables and premium products
Growth Catalysts:
- Govt’s push for electrification & rural infra
- Increasing AC & appliance penetration
- Exports focus (underexploited currently)
7. Balance Sheet
| Item | FY24 (₹ Cr) | FY25 (₹ Cr) |
|---|---|---|
| Equity Capital | 63 | 63 |
| Reserves | 7,384 | 8,261 |
| Borrowings | 303 | 319 |
| Total Liabilities | 12,433 | 13,809 |
| Fixed Assets | 3,988 | 4,652 |
| Cash Equivalents | ~1,953 | ~1,515 |
Takeaway:
- Minimal debt
- Strong reserves
- Capacity being added; CWIP ₹118 Cr
- Cash-generating machine
8. Cash Flow – Sab Number Game Hai
| Year | CFO (₹ Cr) | CFI (₹ Cr) | CFF (₹ Cr) | Net Cash Flow |
|---|---|---|---|---|
| FY23 | +565 | +31 | -907 | -311 |
| FY24 | +1,953 | -1,618 | -534 | -199 |
| FY25 | +1,515 | -305 | -669 | +541 |
Company generates strong cash from ops, invests aggressively, and maintains low debt via internal accruals. Solid.
9. Ratios – Sexy or Stressy?
| Ratio | FY23 | FY24 | FY25 |
|---|---|---|---|
| ROCE (%) | 22 | 24 | 25 |
| ROE (%) | 17.1 | 20.3 | 23.5 |
| OPM (%) | 10 | 10 | 10 |
| Debt/Equity | 0.04x | 0.04x | 0.04x |
| Dividend Payout (%) | 44 | 44 | 43.6 |
All metrics are rock-solid, barring OPM which is still below pre-COVID peak levels of 13–15%.
10. P&L Breakdown – Show Me the Money
| Quarter | Sales (₹ Cr) | PAT (₹ Cr) | EPS (₹) | OPM (%) |
|---|---|---|---|---|
| Q1 FY25 | 4,834 | 287 | 4.58 | 8% |
| Q2 FY25 | 3,900 | 249 | 3.97 | 10% |
| Q3 FY25 | 4,414 | 288 | 4.59 | 10% |
| Q4 FY25 | 5,442 | 447 | 7.13 | 12% |
| Q1 FY26 | 5,455 | 348 | 5.55 | 9% |
Seasonality alert: Q4 always strongest due to summer inventory cycle; Q2 tends to be softer.
11. Peer Comparison
| Company | CMP (₹) | PE | ROCE (%) | OPM (%) | PAT (₹ Cr) |
|---|---|---|---|---|---|
| Dixon Tech | 16,279 | 127x | 39.8 | 3.88 | 774.5 |
| Havells India | 1,532 | 68x | 25.3 | 9.68 | 1,410.3 |
| PG Electroplast | 807.8 | 80x | 19.3 | 9.9 | 287.8 |
| CWD Ltd | 1,500 | 256x | 11.7 | 21.6 | 2.5 |
Takeaway:
Havells is expensive—but not as frothy as Dixon or CWD. It’s the most stable bet in the segment with real brand equity.
12. Miscellaneous – Shareholding, Promoters
| Category | Mar 2025 | Jun 2025 |
|---|---|---|
| Promoters | 59.41% | 59.38% |
| FIIs | 22.31% | 21.59% |
| DIIs | 12.63% | 13.18% |
| Public | 5.52% | 5.62% |
- Minor dip in FII holding
- DII love increasing
- Public float minimal—tight hands = less volatility
13. EduInvesting Verdict™
Havells is what happens when a consumer durables company acts like an FMCG—branding, reach, and reliability with a healthy sprinkle of margin anxiety.
The Good:
- Debt-free
- High ROCE & ROE
- Strong dividend culture
- Trusted brand
The Risks:
- Expensive at 68x PE
- Margin pressure (Lloyd still under integration fix?)
- Slower profit CAGR (only 7% in 3Y)
So…
If you’re seeking a value buy, this ain’t it.
If you’re a long-term investor betting on India’s electrification and premiumisation, this might be your switch.
Metadata
– Written by EduInvesting Team | 21 July 2025
– Tags: Havells, Electricals, Q1 FY26, FMEG, Consumer Durables, Solar Investment, Goldi Solar, Lloyd


