01 — At a Glance
The Pipeline Operator Nobody Talks About (Until Now)
- 52-Week High / Low₹361 / ₹270
- FY25 Revenue₹17,370 Cr
- FY25 PAT₹1,637 Cr
- Full-Year FY25 EPS₹19.69
- Annualised EPS (H1×2)₹12.54
- Book Value₹212
- Price to Book1.36x
- Dividend Yield1.78%
- Debt / Equity0.01x
- Return 1-Year+0.26%
The Setup: GSPL closed FY25 with ₹17,370 crore revenue (down from ₹17,295 crore in FY24). PAT came in at ₹1,637 crore (down from ₹1,585 crore TTM). But wait — PAT margins? Still at 72%. Operating margins? 73%. The regulator just slashed tariffs by 47% in May 2024. So GSPL is earning record-high PAT margins on lower revenue. Either they’ve weaponized cost control, or something is fundamentally different about how regulated pipeline businesses work. Spoiler: it’s both.
02 — Introduction
Welcome to the Sleepiest Infrastructure Business in India
Gujarat State Petronet is not a story. It’s a utility. It lays pipes. Natural gas flows through them. The company extracts a toll. Repeat. Nothing sexy. Nothing volatile. Nothing that would make it past the first slide of a PE pitch deck unless you’re a literal infrastructure fund.
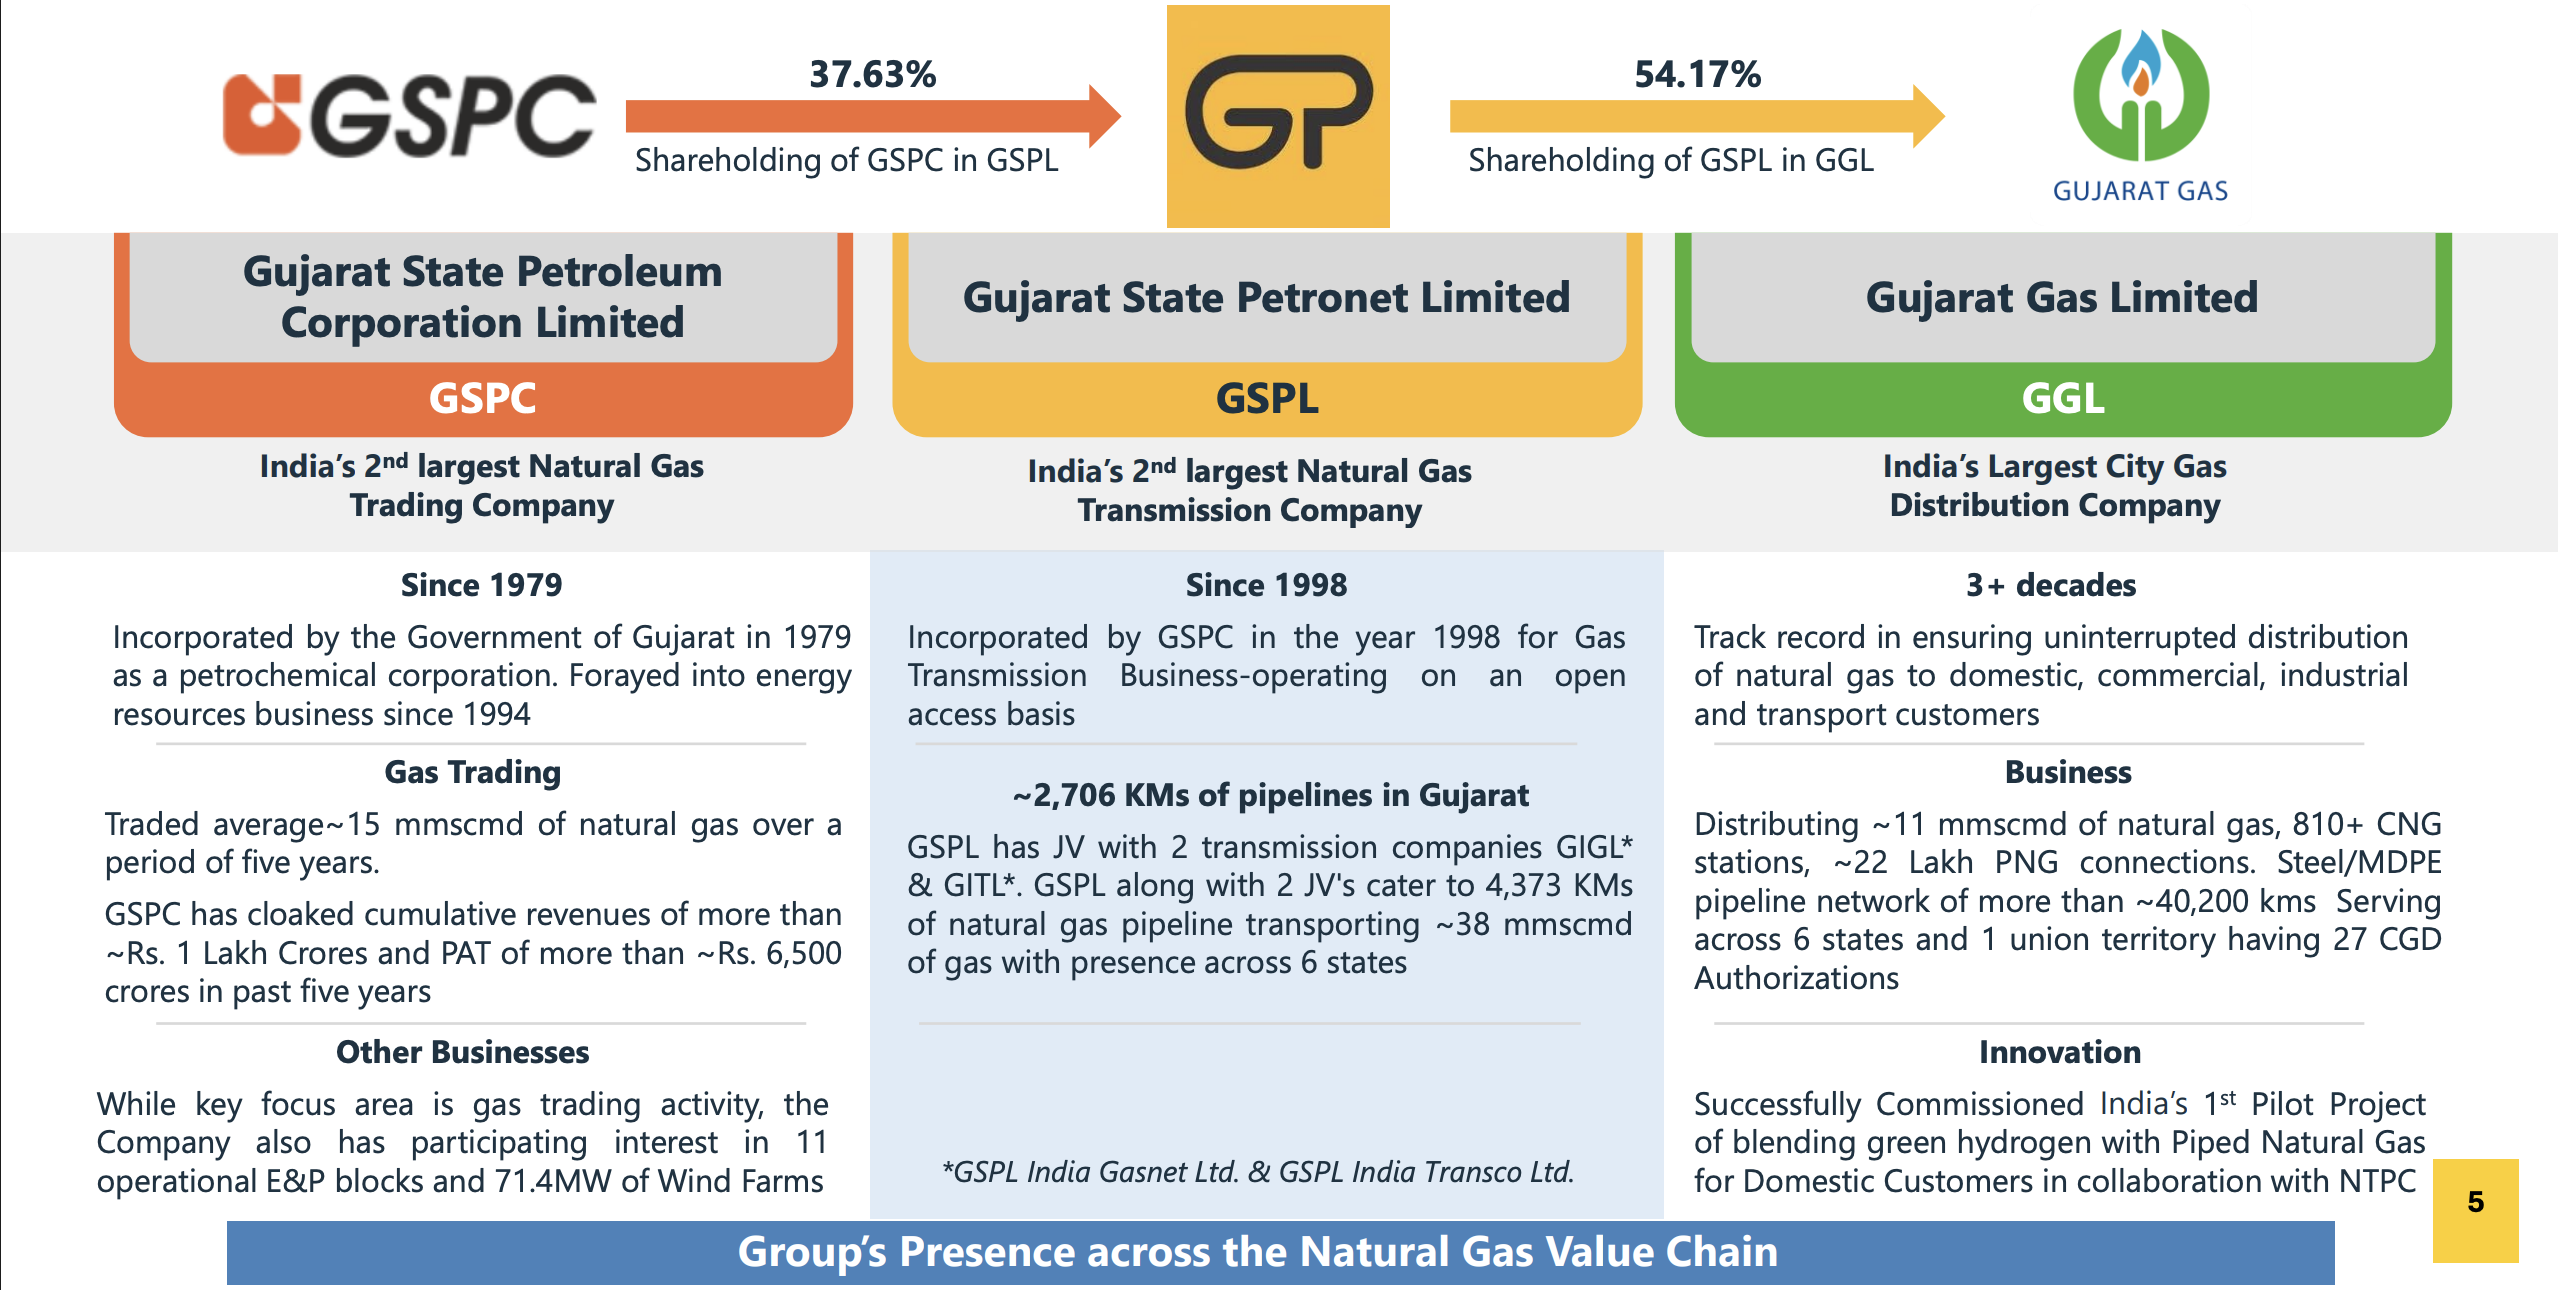
But here’s the thing: GSPL has been a study in boring consistency. It’s the second-largest gas transmission network operator in India after GAIL. It operates 2,795 km of pipelines across Gujarat. It carries ~11,032 MMSCM (million metric standard cubic metres) of gas per year. Customers include CGD (city gas distribution) entities that supply gas to your home, power plants, fertiliser factories, refineries, and petrochemical complexes.
The business model is bulletproof. GSPL doesn’t buy or sell gas — it only transmits it. It charges a regulated tariff determined by the PNGRB (Petroleum and Natural Gas Regulatory Board) using a 12% post-tax return on capital deployed methodology. This is “cost-plus” regulation. The company builds, maintains, and operates the infrastructure. The regulator ensures a guaranteed return. And the taxpayer of India indirectly subsidises natural gas prices by locking GSPL into pre-determined economics.
In May 2024, the PNGRB issued a new tariff order for GSPL’s high-pressure (HP) network, cutting the levelised tariff from ₹34/MMBTU to ₹18.10/MMBTU — a 47% haircut. GSPL has contested it. The stock went nowhere. And somehow, profitability is holding. That’s the paradox we need to unpack.
Timeline Decoder: FY24 (Apr 2023-Mar 2024) saw ₹2,032 Cr operating income at the old ₹34 tariff. FY25 (Apr 2024-Mar 2025) saw only ₹1,111 Cr operating income after the May 2024 tariff cut kicked in. Yet PAT only declined from ₹1,585 Cr (TTM) to ₹1,637 Cr (FY25 audited). Something doesn’t add up until you look at the balance sheet.
03 — Business Model: Pipes, Tolls, And Regulatory Certainty
How To Print Cash While The Government Cuts Your Pricing Power
GSPL operates three distinct businesses, though 98% of revenue comes from one: natural gas transmission. The company builds pipelines, signs long-term Gas Transmission Agreements (GTAs) with customers, and collects transmission tariffs. It doesn’t speculate on gas prices. It doesn’t trade gas. It simply moves it from Point A to Point B and invoices for the service.
The network spans Gujarat, which is the primary gateway for natural gas entering western and northern India. Hazira (domestic production), Shell’s LNG terminal, Petronet’s Dahej terminal, GSPC LNG’s Mundra facility, and Swan LNG’s FSRU all feed into GSPL’s network. The company has a ~15% market share of India’s total gas transmission, second only to GAIL’s ~70%. Competition? Virtually nonexistent. PNGRB’s bidding process ensures exclusive geographical territories. GSPL is the only player in most of its areas of operation.
Revenue visibility comes from GTAs, which range from 1 month to 15+ years. Most include “ship-or-pay” clauses — customers pay the tariff regardless of actual usage (typically covering ~90% of contracted volumes). As of Sep 2025, GSPL had 41.84 MMSCMD of contracted volumes. That’s medium-term predictable cash flow. The leverage is extraordinary. Revenue is almost entirely fixed. Costs are mostly sunk (the pipelines are already built). Margins are protected by regulation. It’s textbook Infrastructure 101.
Market Share~15%India Gas Transmission
Pipeline Km2,795All Gujarat
Contracted Volumes41.84MMSCMD
PAT Margin72%FY25
Regulation Paradox: PNGRB guarantees a 12% post-tax return on capital employed. So GSPL can’t earn above 12% “intended” returns. But because of how cost-plus works, the company’s actual ROE comes from (a) leverage on capital-intensive assets already deployed, and (b) efficiency gains below the cost baseline the regulator assumes. Lower capex than assumed = higher actual returns.
💬 Quick thought: If GSPL’s tariff is cut 47% but profits stay flat, where does the magic happen? Operating leverage? Balance sheet engineering? Or something we haven’t spotted yet? Drop your theory in the comments.
04 — Financials Overview
H1 FY26: The Tariff Cut Already Priced In?
Result type: Half-Yearly Results | H1 FY26 EPS: ₹6.27 | Annualised EPS (H1×2): ₹12.54 | Full-year FY25 EPS: ₹19.69
| Metric (₹ Cr) |
H1 FY26
Oct–Dec 2025 |
H1 FY25
Oct–Dec 2024 |
FY25 Full
Apr–Mar 2025 |
YoY % |
vs FY25 % |
| Revenue | 8,017 | 8,634 | 17,370 | -7.1% | -53.8% |
| Operating Profit | 1,243 | 1,444 | 2,506 | -13.9% | -50.4% |
| OPM % | 15.5% | 16.7% | 14.4% | -120 bps | +110 bps |
| PAT | 525 | 568 | 1,637 | -7.6% | -67.9% |
| EPS (₹) | 6.27 | 6.80 | 19.69 | -7.8% | -68.2% |
The Confusing Bit: H1 FY26 shows lower revenue YoY (-7.1%) and lower PAT (-7.6%). But compare H1 to the full FY25 — of course it’s half. The real insight: GSPL’s operating margins improved to 15.5% in H1 FY26 from 14.4% in full FY25. This suggests cost rationalization post-tariff cut is working. But PAT margins are being dragged by higher depreciation (₹184 Cr in FY25 full year, depreciation running ~₹188 Cr annualised in H1). The tariff cut is real. The pain is real. The recovery in operating leverage is also real.
05 — Valuation: Fair Value Range
What Should A Utility With Halved Earnings Power Cost?
Join 10,000+ investors who read this every week.