General information and entertainment, not investment advice. The author is not a SEBI-registered adviser or research analyst. No recommendation, no promised returns. Markets carry risk including loss of capital. Figures may not be current. Consult a registered adviser before acting.
1 — At a Glance
Gujarat Intrux closed FY26 with revenue of ₹68.76 crore and net profit of ₹10.31 crore — sales up 5.3% on the year, profit down 2.6%. It carries no borrowings, holds ROCE of 21.3%, and pays a dividend yield of 5.62%, one of the highest in its peer set. The market pays 14.8x earnings for it, against an industry P/E of 26.9.
So far, so tidy: a small Rajkot casting foundry that mints cash, dumps most of it back to shareholders, and trades at half the multiple of its neighbours. But two lines on the ratio sheet refuse to sit quietly. Debtor days climbed from 61 to 96, and working capital days stretched from 122 to 236 — nearly doubling in a single year. The cash-and-bank line, meanwhile, shrank from ₹31.68 crore to ₹4.91 crore while receivables jumped from ₹10.88 crore to ₹18.12 crore.
A debt-free balance sheet is a clean room. This one has cash walking out one door and IOUs walking in another. The rest of this entry follows the money.
Does a 5.62% dividend yield answer a doubling of working capital days, or just distract from it?
2 — Introduction
Gujarat Intrux was incorporated in 1992 and listed on the BSE under code 517372. It began life dealing in copper and brass scrap and non-ferrous extrusion, then abandoned that trade — price fluctuations made it unworkable — and reinvented itself as a sand-casting foundry. Today it manufactures Stainless Steel, Non-Alloy Steel and Alloy Steel castings, aimed at valves, pumps and earth-moving equipment.
The operating footprint is a single plant on the Rajkot–Gondal highway at Shapar, and a single reported segment: manufacturing of steel and alloy-steel castings. The Chairman and Managing Director is treated as the sole operating decision-maker, so no further segment split exists.
The most recent corporate housekeeping came in late 2025. On 30 September 2025, MD Dhiraj Pambhar was re-appointed for the term 1 November 2025 to 31 October 2030 at ₹6,75,000 per month, and new statutory and secretarial auditors were brought in. On 29 May 2026 the board approved FY26 audited results and recommended a final dividend of 175% — ₹17.5 per ₹10 share. The statutory auditor, M A A K & Associates, issued an unmodified opinion.
That is the entire public storyline for the period. No orders announced, no acquisitions, no capex programme flagged. A company this quiet leaves the numbers to do the talking.
3 — Business Model: WTF Do They Even Do?
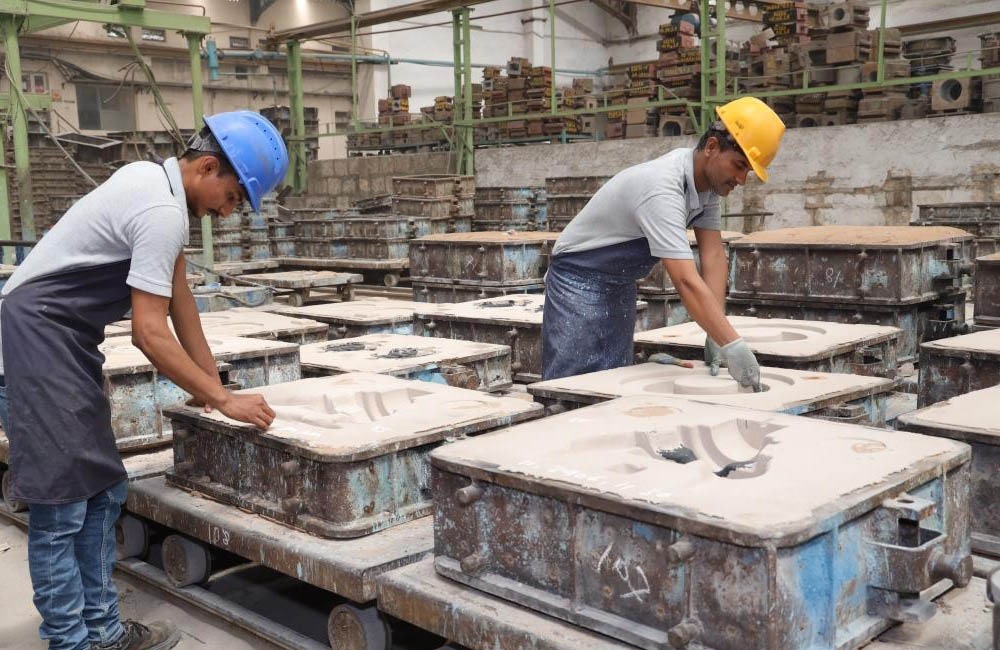
They pour molten metal into sand moulds and sell what hardens.
Stripped of romance, that is the business: Stainless Steel, Non-Alloy Steel and Alloy Steel castings, single pieces up to roughly 2,200 kg, feeding into valves, pumps and earth-moving gear. The associated investment-castings facility carries capacity of about 3,000 MT of alloy and super-alloy castings annually. On the sand-casting side, installed capacity sits at 1,800 MT per year, and production has bounced around — 1,502.92 MT in FY25 against 903.10 MT back in FY21, a plant that has run anywhere from half-full to nearly full depending on the year.
The revenue mix leans on exports. Export sales were roughly 40% of the total in FY25, down from 54% in FY21 — a business that sells abroad heavily but has been drifting homeward. That mix is the quiet risk under the whole enterprise: castings are a commodity dressed up as engineering, and a company that once fled copper because prices moved too much now sells steel castings into global valve and pump markets. The metal changed; the exposure to somebody else’s price chart did not.
What Gujarat Intrux does well is stay small and stay solvent. Sales have compounded at about 15% over five years off a low base, and the plant runs without debt. What it does not do is scale — one plant, one segment, 1,800 MT of sand-casting capacity, and a market cap of ₹153 crore. This is a workshop with a share code, not an industrial platform.
4 — Financials Overview
Figures are consolidated, in ₹ crore.
| Metric | Latest Q (Mar 2026) | YoY | QoQ |
|---|---|---|---|
| Revenue | 18.91 | +11.9% | −7.5% |
| Operating Profit | 3.13 | −6.6% | −36.9% |
| PAT | 1.98 | −23.3% | −47.2% |
| EPS (₹) | 5.76 | −23.3% | −47.2% |
The quarter tells a sharper story than the year. Revenue grew 11.9% against March 2025, but operating profit slipped and PAT fell 23.3%, as the operating margin dropped to 16.55% from 19.82% a year earlier — the figures sit on the results statement. Against the December 2025 quarter, which posted a 24.25% margin, the fall is steeper: PAT nearly halved. The tax rate for the March quarter came in at 35.71%, well above the mid-20s the company ran through the rest of the year, which accounts for part of the profit gap between pre-tax and post-tax.

For the full year, sales of ₹68.76 crore beat FY25’s ₹65.31 crore while PAT of ₹10.31 crore came in just below FY25’s ₹10.59 crore — profit before tax was essentially flat at ₹14.06 crore versus ₹14.05 crore.
5 — Market Expectations & Historical Multiples
This section describes how the market is currently pricing the company and how that compares with its own history and peer group. It is descriptive, not predictive.
| Metric | Current | Historical Average | Peer Median |
|---|---|---|---|
| P/E | 14.8 | — | 26.9 |
| P/B | 2.32 | — | — |
| ROE | 15.6% | 12.5% (5-yr) | — |
| ROCE | 21.3% | — | 14.9% |
The market currently pays 14.8x earnings here, against a peer median of 26.9x — roughly half. On ROCE, the company sits at 21.3% versus a peer median of 14.9%, and its current ROE of 15.6% runs above its own five-year average of 12.5%.
What the market appears to be pricing is a foundry that out-returns its peers on capital while lacking their scale: peer quarterly revenues run from ₹112 crore at Steelcast to ₹1,266 crore at AIA Engineering, against Gujarat Intrux’s ₹18.91 crore. The lower multiple sits alongside the widening working-capital cycle and the profit decline in the latest quarter — both facts drawn from the sections above. The market observation to record is simply this: a company earning peer-beating returns on capital is priced at a peer-trailing multiple, and the two facts coexist on the same sheet.
6 — What’s Cooking
Two events define the period, and only two.
First, the FY26 final dividend of 175% — ₹17.5 per share — recommended by the board on 29 May 2026, pending shareholder approval. The full-year dividend outflow was ₹6.02 crore against ₹10.31 crore of profit, a payout of roughly 58%.
Second, the leadership refresh from September 2025: MD Dhiraj Pambhar re-appointed through October 2030 at ₹6,75,000 per month, with fresh statutory and secretarial auditors installed. A company changing auditors and locking in its MD for a five-year term in the same stroke is worth noting as a fact — new eyes on the books, same hand on the wheel.
No orders, no capex, no M&A were announced for the year. Three real events, three recorded. The spice, such as it is, lives in the balance sheet rather than the press releases.
7 — Balance Sheet
| Item | FY24 | FY25 | FY26 |
|---|---|---|---|
| Total Assets | 70.64 | 72.47 | 72.32 |
| Net Worth | 62.00 | 66.73 | 65.83 |
| Borrowings | 0.00 | 0.00 | 0.00 |
| Other Liabilities | 8.64 | 5.74 | 6.49 |
| Total Liabilities | 70.64 | 72.47 | 72.32 |
Assets equal liabilities in every column, and borrowings are a flat zero across all three years — the debt-free claim survives inspection.
- Total assets barely moved in FY26 (₹72.47 crore to ₹72.32 crore), yet the composition shifted hard: receivables rose from ₹10.88 crore to ₹18.12 crore while the cash-and-bank line fell from ₹31.68 crore to ₹4.91 crore, per the data sheet arithmetic.
- Net worth actually dipped ₹0.90 crore despite a ₹10.31 crore profit — the dividend took more out than the year put in.
- Zero borrowings and interest cover of 352x mean the finance cost line (₹0.04 crore) is a rounding error, not a liability.
A balance sheet that stands still while its insides rearrange is telling you the story isn’t in the total — it’s in the mix.
8 — Cash Flow: Sab Number Game Hai
| Year | Operating | Investing | Financing |
|---|---|---|---|
| FY24 | 1.46 | 1.27 | −3.27 |
| FY25 | 6.14 | −0.88 | −5.56 |
| FY26 | 15.01 | −0.64 | −11.13 |
FY26 was the strongest operating cash year on record here at ₹15.01 crore, more than double FY25’s ₹6.14 crore. Investing was near-flat at −₹0.64 crore, and financing ran to −₹11.13 crore, dominated by dividend payment. Net cash flow for the year was +₹3.24 crore.
The trajectory is clean at the top and heavy at the bottom: the foundry generated real operating cash and then routed most of it straight out to shareholders. A business that converts profit to cash and hands it back is doing exactly what a mature, unscaling foundry does — the money game here is distribution, not reinvestment.
9 — Ratios: Sexy or Stressy?
| Ratio | Value |
|---|---|
| ROE | 15.6% |
| ROCE | 21.3% |
| P/E | 14.8 |
| PAT Margin | 15.0% |
| D/E | 0.00 |
ROCE of 21.3% shows the capital in this foundry is working a full shift — well above the peer median of 14.9%. ROE of 15.6% runs a step below ROCE, which is what happens when a debt-free company can’t borrow to juice returns; the equity carries the whole load. The PAT margin of 15.0% says fifteen paise of every revenue rupee survives to the bottom line, respectable for commodity castings. D/E of 0.00 is the cleanest number on the page — there is simply nothing owed. The P/E of 14.8 describes what the market pays today, and it pays less here than for the ratios beneath it might suggest in isolation.
10 — P&L Breakdown: Show Me the Money
| Year | Revenue | Operating Profit | Other Income | PAT | EPS (₹) |
|---|---|---|---|---|---|
| FY24 | 57.19 | 10.2 | 1.46 | 7.41 | 21.57 |
| FY25 | 65.31 | 13.8 | 1.51 | 10.59 | 30.83 |
| FY26 | 68.76 | 14.0 | 1.59 | 10.31 | 30.01 |
The three-year arc is a business that grew revenue every year and grew operating profit alongside it — ₹10.2 crore to ₹14.0 crore — before flattening at the top in FY26. Other Income sits at ₹1.59 crore, small next to ₹14.0 crore of operating profit, which is the reassuring part: this profit is made in the foundry, not in the treasury. Roughly one rupee in nine of pre-tax income comes from non-operating sources; the rest is castings.
EPS fell from ₹30.83 to ₹30.01 while PAT fell from ₹10.59 crore to ₹10.31 crore — both down together, on a share count unchanged at 34.35 lakh shares. The EPS dip is the profit dip, nothing hidden, no dilution at work. FY25 was the peak year; FY26 held the line rather than building on it.
11 — Peer Comparison
| Company | Revenue (Qtr) | PAT (Qtr) | P/E |
|---|---|---|---|
| AIA Engineering | 1266.27 | 393.33 | 35.17 |
| Happy Forgings | 423.84 | 83.56 | 48.30 |
| Nelcast | 368.18 | 15.27 | 26.41 |
| Steelcast | 112.43 | 23.18 | 34.99 |
| Gujarat Intrux | 18.91 | 1.98 | 14.83 |
Gujarat Intrux is the smallest name on the board by a distance — its quarterly revenue of ₹18.91 crore is a rounding error next to AIA Engineering’s ₹1,266 crore. It also carries the lowest multiple in the set at 14.8x, against a peer median of 26.9x, while posting a ROCE (21.3%) that beats most of the group. The comparison records a size gap and a multiple gap pointing in opposite directions: the smallest foundry earns like the bigger ones on capital but is priced well below them.
12 — Miscellaneous: Shareholding & Promoters
| Holder | % |
|---|---|
| Promoters | 58.60 |
| Institutions | ~0 |
| Public | 41.39 |
Promoter holding sits at 58.60%, nudged up marginally over the year, with zero pledging. The register is a dense web of the Pambhar, Dudhagara, Patoliya, Kalaria and Sabhaya families — a classic closely-held Gujarat promoter group where names repeat across dozens of small individual holdings. Institutional ownership is essentially absent; the non-promoter float of 41.39% is public shareholders, and the shareholder count has grown from 2,529 to 6,270 over recent quarters. The Investor Education and Protection Fund holds 3.70%, a reminder of shares long unclaimed. No promoter roast is warranted on conduct here — the holding is stable, unpledged, and the promoter took a defined salary rather than anything exotic.
13 — Corporate Governance: Angels or Devils?
The record for FY26 is clean on the page. The statutory auditor, M A A K & Associates, issued an unmodified opinion on the year-end results, and the CFO certified the figures as free of material omission. New statutory and secretarial auditors were appointed in September 2025 — a change worth noting as a fact, though the incoming auditor signed off without qualification. Borrowings are nil, pledging is nil, and no tax demand, resignation, or related-party controversy appears in the disclosures for the period. The one governance item on record is the MD’s re-appointment through October 2030 at ₹6,75,000 per month, approved by the board he chairs. On the visible evidence, there are no red flags to flag.
14 — Industry Roast & Macro Context
The steel-castings trade is where engineering meets commodity, and commodity usually wins the argument. Foundries sell precision-shaped metal into valves, pumps and earth-movers, then discover that their selling price rides on global steel and alloy prices they don’t set — the same lesson that once chased this company out of copper. Export-heavy casters carry a second passenger: currency and overseas demand cycles that no plant in Rajkot controls. Capacity is lumpy and expensive, utilisation swings with the order book, and pricing power belongs to whoever the customer is, not the foundry. It’s a sector where a debt-free balance sheet isn’t caution — it’s survival gear, because the one thing worse than a commodity margin is a commodity margin with an interest bill attached.
15 — EduInvesting Verdict
| Strengths | Weaknesses |
|---|---|
| Zero debt, 352x interest cover | Working capital days doubled to 236 |
| ROCE 21.3%, above peer median | PAT down 2.6% in FY26, −23.3% in Q4 |
| Opportunities | Threats |
| 15% five-year sales CAGR off a low base | Receivables surged; cash-and-bank line fell hard |
| Priced at 14.8x vs 26.9x peer median | Single plant, single segment, commodity exposure |
Gujarat Intrux is a small, debt-free foundry that earns better returns on capital than most of its listed peers, pays out most of its profit, and asks the market for a modest multiple. The FY26 record is a business that held its ground on profit while its balance sheet quietly rearranged — cash out the front, receivables in the back, working-capital days doubling in twelve months.
A foundry with nothing owed and everything collected on time is a machine; a foundry with nothing owed and receivables climbing is a question waiting on its next collection cycle.