At a Glance
Greenpanel Industries – India’s MDF market leader with 27% share – just reported a ₹34.6 Cr quarterly loss, blaming forex hits on ECB loans. Revenue fell 10% YoY to ₹328 Cr, margins went negative, and the stock is now carving out its own misery at ₹320. Investors are asking: Is this MDF or MIA (Missing in Action)?
Introduction
Greenpanel’s story is like that one IKEA table – looks strong, but one wrong screw and it wobbles. Riding on India’s MDF boom, the company grew aggressively. But Q1 FY26 saw profits crumble faster than cheap particle board. Management blamed forex losses, but underlying demand softness and margin squeeze were the real termites.
Business Model (WTF Do They Even Do?)
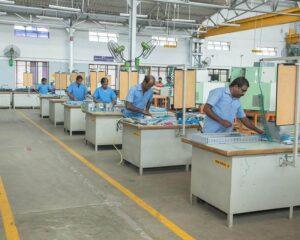
- Core Business: Manufacturing MDF, plywood, and allied products.
- Markets: Automotive, furniture, interiors.
- Moat: Largest MDF player in India with eco-labeled products.
- Roast: Selling MDF at premium P/E (180x!) while profits vanish – bold strategy.
Financials Overview
Q1 FY26
- Revenue: ₹328 Cr (↓10% YoY)
- Operating Profit: -₹16 Cr (negative margin -5%)
- PAT: -₹35 Cr (vs ₹8 Cr last Q4)
- EPS: -₹2.82
FY25
- Revenue: ₹1,436 Cr
- PAT: ₹72 Cr (↓47%)
- ROE: 5.3%
- Dividend: Token payout.
Comment: High P/E, low earnings – classic market delusion.
Valuation
- P/E Method
- EPS TTM: ₹1.78
- Sector P/E: 40x
- Value: ₹70
- EV/EBITDA
- EBITDA TTM: ₹79 Cr
- EV/EBITDA: 8x
- Value: ₹120
- DCF (Generous)
- Future growth: 5%
- WACC: 12%
- Value: ₹110–130
🎯 Fair Value Range: ₹100 – ₹130
CMP ₹320 → trading at fantasy-land valuations.
What’s Cooking – News, Triggers, Drama
- Forex loss killed Q1.
- Demand slump in MDF as imports undercut prices.
- Trigger: Price hikes or cost optimization.
- Risk: Housing slowdown, cheap imports.
Balance Sheet
| (₹ Cr) | Mar 2025 |
|---|---|
| Assets | 2,136 |
| Liabilities | 338 |
| Net Worth | 1,385 |
| Borrowings | 413 |
Remark: Moderate leverage, but forex-linked debt bites.
Cash Flow – Sab Number Game Hai
| (₹ Cr) | FY23 | FY24 | FY25 |
|---|---|---|---|
| Operating | 339 | 135 | 78 |
| Investing | -254 | -156 | -166 |
| Financing | -131 | 50 | 82 |
Remark: Ops cash collapsing – smells of stress.
Ratios – Sexy or Stressy?
| Metric | Value |
|---|---|
| ROE | 5.3% |
| ROCE | 4.5% |
| P/E | 180x |
| PAT Margin | 1.5% |
| D/E | 0.3 |
Remark: Valuation sexy, fundamentals stressy.
P&L Breakdown – Show Me the Money
| (₹ Cr) | FY23 | FY24 | FY25 |
|---|---|---|---|
| Revenue | 1,783 | 1,567 | 1,436 |
| EBITDA | 413 | 246 | 131 |
| PAT | 230 | 135 | 72 |
Remark: Profit collapse continues like a badly glued panel.
Peer Comparison
| Company | Revenue (₹ Cr) | PAT (₹ Cr) | P/E |
|---|---|---|---|
| Century Plyboards | 4,528 | 193 | 84x |
| Greenlam Industries | 2,569 | 66 | 93x |
| Greenply Industries | 2,505 | 83 | 50x |
| Greenpanel Inds. | 1,399 | 22 | 180x |
| Stylam Industries | 1,025 | 122 | 24x |
Remark: Trades at highest P/E with weakest profits.
Miscellaneous – Shareholding, Promoters
- Promoters: 53.1%
- FIIs: Falling (1.6%)
- DIIs: Increasing (28.8%)
- Public: 16.5%
Observation: FIIs bailing out, DIIs holding nervously.
EduInvesting Verdict™
Greenpanel is a classic overvalued turnaround hope. Market priced it like a luxury Italian furniture brand, but Q1 proved it’s just another MDF sheet under pressure. Unless forex risks settle and margins recover, the stock could see a valuation sanding down.
SWOT Quickie
- Strengths: Market leader, eco-certified products.
- Weaknesses: Forex losses, low margins, falling profits.
- Opportunities: Rising demand for MDF in India.
- Threats: Imports, housing slowdown, high P/E.
Final Word: This panel needs reinforcement – or investors risk being nailed.
Written by EduInvesting Team | 30 July 2025
SEO Tags: Greenpanel Q1 FY26 Results, MDF Market India, Greenpanel Earnings Analysis


