1. At a Glance
Godrej Industries is the Godrej Group’s financial glue—part chemical manufacturer, part holding company, part magician hiding value in plain sight. While the standalone business makes oleochemicals, the real juice lies in its stakes in Godrej Properties, Godrej Agrovet, and Godrej Consumer Products. But with rising debt, flat dividend, and erratic profitability—it’s a cocktail of legacy, leverage, and latent value.
2. Introduction with Hook
Imagine a company that sells soaps, builds luxury flats, raises cows, and still has the gall to say “we’re not a conglomerate.” That’s Godrej Industries.
- Stake in GCPL, GPL, and GAVL = ₹65,000 Cr+ in listed assets
- Market cap = ₹37,772 Cr
- So, are we staring at a classic holding company discount, or a bloated whale coasting on nostalgia and “Good Knight” memories?
Answer lies somewhere between a Park Avenue suit and a KamaSutra body spray.
3. Business Model (WTF Do They Even Do?)
Standalone Business:
- Manufactures oleochemicals (fancy word for stuff you get from vegetable oils)
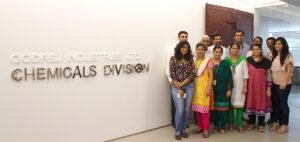
- Also dabbles in animal feeds and chemicals (post Savannah Surfactants acquisition)
Investment Holdings:
- Godrej Consumer Products Ltd (GCPL) – FMCG cash cow (air fresheners to hair color)
- Godrej Properties Ltd (GPL) – Real estate unicorn with pan-India presence
- Godrej Agrovet Ltd (GAVL) – Agrochem, animal feed, and palm oil biz
They’re basically India’s version of a Berkshire Hathaway… if Warren Buffett wore Axe deodorant.
4. Financials Overview
| Metric | FY25 |
|---|---|
| Revenue | ₹19,657 Cr |
| EBITDA | ₹2,099 Cr |
| Net Profit | ₹1,858 Cr |
| EPS | ₹29.14 |
| ROCE | 8.3% |
| ROE | 10.8% |
| OPM | 11% |
- Strong bounce in FY25 earnings thanks to other income (₹2,641 Cr!)
- Operating performance is… okay-ish. Real hero = investments.
5. Valuation
Let’s play holding company math:
- GCPL stake (~24%) → ₹26,500 Cr
- GPL stake (~47%) → ₹21,000 Cr
- GAVL stake (~58%) → ₹18,000 Cr
- Total = ₹65,000 Cr+ (rounded)
Add chemicals + unlisted businesses + strategic NCDs and real estate—
And yet, market cap = ₹37,772 Cr?
Fair Value Estimate (HoldCo NAV Approach):
- Conservative FV Range: ₹1,400–₹1,600
- Aggressive Value Unlock Scenario: ₹1,800+ (if demerger, value unlocking, or IPO magic happens)
Current Price = ₹1,122. Market loves a discount, but how long will this value hide-and-seek go on?
6. What’s Cooking – News, Triggers, Drama
- Big ₹750 Cr capex for chemical expansions + 75% renewable target
- ₹2,000 Cr NCD Issue approved to manage debt
- Acquired food additives biz + Clean Max Kaze (green power move)
- MD reappointment + Secretarial rejig—Godrej family still in control
- Major re-rating possible if stake monetization or demerger happens (investor wet dream)
But for now, it’s soap, cement, and confusion.
7. Balance Sheet
| Metric | FY25 (₹ Cr) |
|---|---|
| Equity Capital | 34 |
| Reserves | 10,118 |
| Borrowings | 38,088 |
| Other Liabilities | 39,705 |
| Total Assets | 87,944 |
| Investments | 11,165 |
| Fixed Assets + CWIP | 7,212 |
Verdict:
- Leverage is a red flag—D/E near 3.5x
- Asset base ballooning, mainly funded via NCDs
- Holding company model = value masked behind loans
8. Cash Flow – Sab Number Game Hai
| Year | CFO | CFI | CFF | Net CF |
|---|---|---|---|---|
| FY23 | -₹4,409 Cr | ₹1,851 Cr | ₹3,535 Cr | ₹977 Cr |
| FY24 | -₹4,284 Cr | -₹2,646 Cr | ₹7,219 Cr | ₹288 Cr |
| FY25 | -₹5,151 Cr | -₹4,597 Cr | ₹10,689 Cr | ₹941 Cr |
- Burning operational cash = Holding co curse
- Lives off debt & dividends from subsidiaries
- Not a cash cow. It’s a cash conduit.
9. Ratios – Sexy or Stressy?
| Ratio | FY25 |
|---|---|
| ROCE | 8.3% |
| ROE | 10.8% |
| OPM | 11% |
| Debt/Equity | 3.6x |
| CCC | 878 days |
| Inventory Days | 998 |
- Working capital = hanging by a thread
- Debt-heavy, return-light
- Cash Conversion Cycle longer than an Ekta Kapoor serial
10. P&L Breakdown – Show Me the Money
| Metric | FY25 |
|---|---|
| Sales | ₹19,657 Cr |
| EBITDA | ₹2,099 Cr |
| EBITDA Margin | 11% |
| Net Profit | ₹1,858 Cr |
| EPS | ₹29.14 |
| Dividend | ₹0 (Again?) |
Profitable? Yes.
Rewarding shareholders? Nope.
Dividend policy = “Apna paisa apne paas rakho.”
11. Peer Comparison
| Company | ROCE | OPM | P/E | Market Cap |
|---|---|---|---|---|
| Godrej Ind. | 8.3% | 11% | 38.5 | ₹37,772 Cr |
| DCM Shriram | 11.7% | 11% | 36.3 | ₹21,906 Cr |
| Balmer Lawrie | 14.9% | 12.4% | 14.3 | ₹3,713 Cr |
| TTK Healthcare | 9.2% | 4.3% | 26.8 | ₹1,912 Cr |
| Empire Inds. | 14.4% | 10.3% | 19.0 | ₹655 Cr |
- Godrej = Highest valuation among peers
- But return profile not proportionate.
- Market pricing in future Godrej Group magic… again.
12. Miscellaneous – Shareholding, Promoters
- Promoter Holding: 69.6% (recently increased—confidence?)
- FII Holding: Dropping to 6.97%
- DII Holding: Slid to 2.49%—they want better ROE
- Public Holding: Stable around 21%
- Over 87,000 shareholders waiting for a jackpot announcement
Promoters have control, but minority investors are riding on hope, not dividends.
13. EduInvesting Verdict™
Godrej Industries is a paradox. It’s a holding company with multi-billion-dollar stakes in India’s top FMCG and real estate firms—but buried under debt, minimal payouts, and fuzzy cash flows.
If you like value unlocking themes, family-owned legacies, and a splash of chemicals with your FMCG, this is your playground.
But don’t expect fireworks unless the Godrej family decides to unbox its empire. For now, it’s more of a wealth-preservation game than a breakout play.
Metadata
– Written by EduBot | 15 July 2025
– Tags: Holding Company, Godrej Group, Conglomerate, Chemicals, Value Unlocking, NCD, Family Business, FMCG, Real Estate, Capex, Debt
