General information and entertainment, not investment advice. The author is not a SEBI-registered adviser or research analyst. No recommendation, no promised returns. Markets carry risk including loss of capital. Figures may not be current. Consult a registered adviser before acting.
1. At a Glance
Global Surfaces sells engineered quartz and natural stone slabs to countertop markets across the US, UAE and beyond. In FY26 it did ₹233 crore of that — the highest revenue in its recorded history — and still lost ₹30.4 crore at the owners’ level. Revenue climbed 12.3% while operating profit went from ₹2 crore to negative ₹11 crore, and net worth eroded from ₹302 crore to ₹271 crore.
The FY26 file carries a lot of moving parts: the Bagru natural-stone unit was discontinued from March 31, 2026; a ₹1.74 crore income-tax penalty landed in June 2026; the statutory auditor was changed mid-year; and one man now holds Chairman, Managing Director and Chief Financial Officer simultaneously. The Dubai subsidiary carried a segment loss of ₹391.76 crore-equivalent (₹392 million) worth of pain into consolidated numbers.
Other income of ₹21.7 crore is the quiet figure here — it’s larger than any operating profit the business produced this year, because the business produced none.
One observation before the detail: a company can grow its top line and shrink its own equity in the same twelve months, and both statements can be true at once. Global Surfaces is currently the proof.
What happens when the highest revenue year is also the year the factory closes?
2. Introduction
Global Surfaces Limited, headquartered in Jaipur and on the exchanges since 2023, manufactures and exports engineered quartz surfaces and processes natural stone — granite, marble, quartzite — into slabs and countertops. The output goes overwhelmingly abroad: exports were roughly 95% of FY26 revenue, with the United States and the MENA region the primary destinations.
The manufacturing footprint spans three units: Bagru (Jaipur) for natural stone, the Mahindra World City SEZ (Jaipur) for engineered quartz, and a leased facility at Jebel Ali Free Zone, Dubai, run through wholly-owned subsidiary Global Surfaces FZE. Two US entities — Global Surfaces Inc. and Superior Surfaces Inc. — handle distribution stateside.
FY26 brought structural change rather than steady operation. The Board approved discontinuation of the Bagru natural-stone unit effective March 31, 2026, citing sustained losses and continued capacity under-utilisation; an orderly closure and disposal plan are underway. Management attributed the year’s revenue and margin pressure to elevated tariffs on India-origin exports, deferred US offtake, and roughly 45 days of disruption tied to Red Sea and regional conflict affecting the Dubai unit’s logistics. A ₹100 crore inter-company loan to the Dubai subsidiary was approved for conversion into equity in March 2026, pending Free Zone authority formalities.
The audit opinion for the year was unmodified.
3. Business Model: WTF Do They Even Do?
They grind quartz, mix it with resin, press it into slabs, and sell those slabs to people building kitchens in other countries. Engineered stone — roughly 90% ground quartz, 10% resins and pigments, marketed under a patented “Marquartz” range licensed from a Florida firm and a Chinese one — is the core, at 94% of FY26 segment revenue. Natural stone is the remaining 6%, and shrinking: natural-stone sales volume fell from 55,429 sqm in FY23 to 27,575 sqm in FY26, roughly halving in three years. The Bagru unit that made it is now closed.

The model’s defining feature is geography. Around 95% of revenue leaves the country, which means the business is a bet on foreign kitchen renovations financed with foreign construction cycles and shipped through foreign ports. When US tariffs on India-origin quartz rise and Red Sea shipping seizes up, both happen to the same company at the same time — and in FY26, per management, both did.
The segment map tells the sharper version. In FY26 the India operation posted a positive segment result of ₹164.4 crore-equivalent, the US operation lost ₹29 crore-equivalent, and the UAE operation — the shiny Dubai quartz facility — lost ₹392 crore-equivalent. The crown jewel is the biggest hole in the boat.
The engineered-quartz story is genuinely differentiated on technology — patented veining, premium raw material, a real R&D facility. What it hasn’t yet done is convert into profit at the group level.
4. Financials Overview
Figures are consolidated, in ₹ crore. The latest reported period is the quarter ended March 2026 (Q4 FY26).
| Metric | Latest Q (Mar 2026) | YoY | QoQ |
|---|---|---|---|
| Revenue | 45.4 | -21.0% | -23.4% |
| Operating Profit | -19.0 | from -1.9 | from +3.2 |
| PAT (owners) | -22.3 | from -10.5 | from -3.0 |
| EPS (₹) | -5.27 | from -2.48 | from -0.71 |
The March quarter was the worst single quarter on the visible record: revenue down 21% year-on-year, operating profit swinging to a ₹19 crore loss, and a ₹22.3 crore bottom-line loss that alone is about three-quarters of the full-year loss.
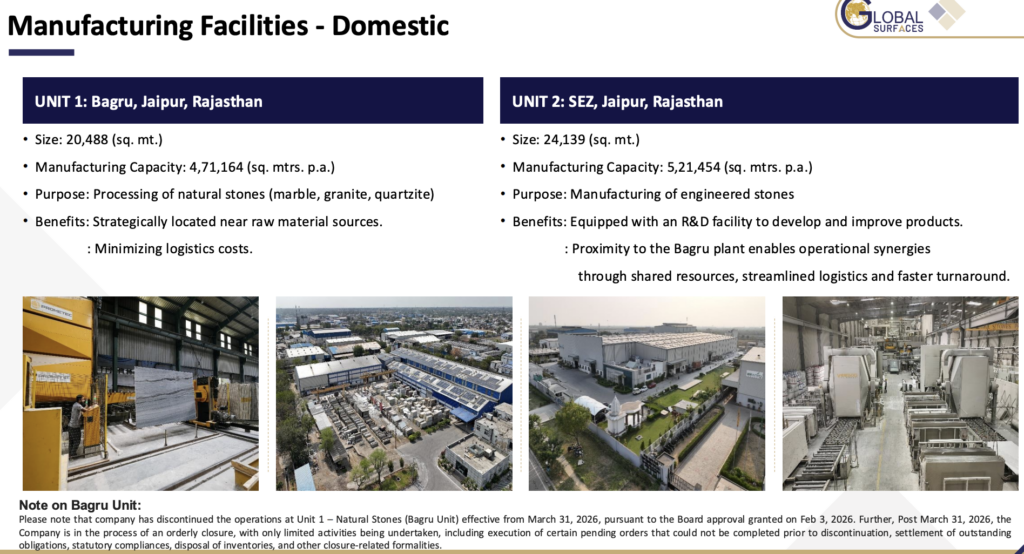
From the Q4 earnings presentation: management flagged challenging demand from tariff uncertainty, geopolitical disruption, and subdued export markets, plus approximately 45 days of operational disruption from the regional conflict. It also noted the Dubai FZE operation remained cash-profitable before non-cash provisions against inventory and receivables — meaning the reported loss there absorbed provisioning, per management’s framing.
5. Market Expectations & Historical Multiples
This section describes how the market is currently pricing the company and how that compares with its own history and peer group. It is descriptive, not predictive.
| Metric | Current | Historical Average | Peer Median |
|---|---|---|---|
| P/E | Not meaningful (loss) | — | 41.3x |
| P/B | 0.63x | — | — |
| ROE | -10.6% | 1.4% (5-yr) | 5.7% (ROCE, peer) |
| ROCE | -1.62% | — | 5.66% |
With FY26 earnings negative, no P/E exists to state — the market cannot pay a multiple on a loss. The company carries a market capitalisation of about ₹170 crore against a book value of roughly ₹271 crore, which places the price-to-book at 0.63x — the market currently values the equity below its stated carrying amount. The peer set trades on a median P/E of 41.3x, but those peers (Midwest, Pokarna, Pacific) posted positive quarterly profits, so the comparison is one of category rather than degree.
What the market appears to be weighing here, using only the article’s facts: an eroding net worth, a discontinued unit, a loss-making Dubai subsidiary mid-restructuring, and a ₹100 crore loan-to-equity conversion still pending — against a growing revenue line and a below-book price. The single factual observation on expectations: the equity is priced beneath its book value while the business reported losses in two consecutive years.
6. What’s Cooking
Five material items sit in the FY26 filings, and none of them are quiet.
The Bagru natural-stone unit was discontinued from March 31, 2026, with a disposal plan approved in principle. A ₹1.74 crore penalty under Section 271D of the Income-tax Act arrived on June 30, 2026, for alleged Section 269SS violations in AY 2019-20; the company says it will appeal. Separately, an assessment order dated March 31, 2026 raised a demand of ₹37.49 crore for AY 2023-24. The Board approved converting a ₹100 crore inter-company loan to the Dubai FZE into equity, pending Jebel Ali Free Zone approval. And independent director Yashwant Kumar Sharma was re-designated to non-independent status effective July 1, 2026.
For a ₹170 crore company, a ₹37.49 crore tax demand is not a footnote — it is roughly 22% of market cap sitting in one contested line.
7. Balance Sheet
| Item (₹ cr) | Mar 2024 | Mar 2025 | Mar 2026 |
|---|---|---|---|
| Total Assets | 521.8 | 557.5 | 540.7 |
| Net Worth | 330.5 | 302.3 | 270.6 |
| Borrowings | 144.6 | 199.5 | 213.8 |
| Other Liabilities | 46.7 | 55.7 | 56.4 |
| Total Liabilities | 521.8 | 557.5 | 540.7 |
Assets equal liabilities in every column; the sheet balances.
- Net worth fell ₹60 crore over two years while borrowings rose ₹69 crore over the same span — equity and debt trading places in real time.
- Borrowings now sit at ₹214 crore against ₹271 crore of equity, a debt-to-equity of 0.79, up from 0.46 two years prior.
- Total assets actually shrank ₹17 crore in FY26 — a balance sheet that stopped growing in the same year revenue hit a record.
A balance sheet can add debt and lose equity simultaneously; the total will still tie out. Arithmetic is loyal that way.
8. Cash Flow: Sab Number Game Hai
| Year | Operating | Investing | Financing |
|---|---|---|---|
| FY24 | -37.3 | 9.0 | 24.3 |
| FY25 | -31.2 | -6.0 | 37.4 |
| FY26 | 27.5 | -10.4 | -16.0 |
After two years of negative operating cash flow, FY26 flipped to a positive ₹27.5 crore from operations — the one genuinely improved line in the file, driven by working-capital release as receivables and inventory came down. Financing turned negative as the company repaid rather than raised. The story the cash flow tells is tighter working-capital management even as the P&L bled: money came in from operations while profit did not.
9. Ratios: Sexy or Stressy?
| Ratio | Value |
|---|---|
| ROE | -10.6% |
| ROCE | -1.62% |
| P/E | Not meaningful (loss) |
| PAT Margin | -13.0% |
| D/E | 0.79 |
ROE at -10.6% means the equity destroyed value rather than earned it this year. ROCE at -1.62% says the capital employed — debt and equity together — generated a negative return on the business’s own operations. PAT margin of -13% is the plain statement that every ₹100 of revenue left about ₹13 of loss behind. D/E at 0.79 shows the company leaning harder on borrowed money as its own equity thinned. The one ratio pointing up is nowhere on this table: it’s the operating cash flow in Section 8.
Debtor days stood at 151 and inventory days at 277 — money tied up in customers and stock for well over a year of combined cycle.
10. P&L Breakdown: Show Me the Money
| Year | Revenue | Operating Profit | Other Income | PAT | EPS (₹) |
|---|---|---|---|---|---|
| FY24 | 225 | 35 | 4 | 18.7 | 4.41 |
| FY25 | 208 | 2 | 7 | -28.5 | -6.73 |
| FY26 | 233 | -11 | 22 | -30.4 | -7.18 |
The Other Income column is the one to watch. In FY26 the business generated an operating loss of ₹11 crore, while other income came in at ₹21.7 crore — non-operating income that exceeds the entire operating result and yet still couldn’t drag the year into profit, because interest and depreciation carried the pre-tax line to a ₹23 crore loss. Operating profit has now fallen from ₹35 crore to negative territory in two years, a collapse of the actual manufacturing economics; the revenue line grew through the same period, which tells you volume held while margin per unit did not.
EPS moved with PAT throughout — the share count was steady at 4.24 crore shares, so the loss per share reflects the loss, not dilution.
11. Peer Comparison
| Company | Revenue (Qtr, ₹ cr) | PAT (Qtr, ₹ cr) | P/E |
|---|---|---|---|
| Midwest | 215.8 | 37.0 | 43.5 |
| Pokarna | 147.2 | 25.6 | 39.2 |
| Global Surfaces | 45.4 | -23.4 | — |
| Esprit Stones | 73.3 | -1.2 | — |
| Pacific Inds | 38.5 | 0.4 | 46.8 |
Among the granite-and-marble set, Midwest and Pokarna carried both the largest quarterly revenue and positive profit, and priced on P/E multiples in the low-40s. Global Surfaces sits in the middle of the group by quarterly revenue but posted the largest absolute quarterly loss on the table at ₹23.4 crore — so no P/E computes. Esprit Stones shares the loss-making status; the profitable peers are the ones the market assigns a multiple to.
12. Miscellaneous: Shareholding & Promoters
| Holder | % (Mar 2026) |
|---|---|
| Promoters | 73.25 |
| Institutions (FII+DII) | 1.59 |
| Public | 25.15 |
Promoter holding is high and steady at 73.25%, with Mayank Shah alone holding 55.46%. There is no pledging — the promoter stake is unencumbered. Institutional interest is thin: FIIs hold 1.59% and DIIs effectively nil, and FII holding has drifted down from about 4.85% in mid-2023.
Mayank Shah, the promoter, carries more than two decades in the stones industry and, as of October 2025, holds the Chairman, Managing Director and CFO titles together — a concentration worth noting as a structural fact of how this company is run.
13. Corporate Governance: Angels or Devils?
The FY26 record has genuine flags, all sourced from filings. The statutory auditor changed during the year, with the prior auditor resigning ahead of Q2 FY26 results; the year-end audit by Ummed Jain & Co. carried an unmodified opinion. A VP of Operations & Strategy resigned in November 2025. One promoter holds Chairman, MD and CFO simultaneously — the person who runs the company also signs off on its finances and chairs the board that oversees both. An independent director was re-designated to non-independent, reducing the independent count.
On tax: a ₹1.74 crore Section 271D penalty and a separate ₹37.49 crore demand for AY 2023-24 are both live, both under appeal or review. The auditors also drew emphasis-of-matter attention to US-market exposure and the Bagru closure — disclosures, not qualifications.
The board he chairs approved his re-appointment structure and the unit closure; the opinion stayed unmodified throughout.
14. Industry Roast & Macro Context
The engineered-stone export trade is a business of making a heavy, low-margin-per-kg product in one country and shipping it across oceans to be installed in someone else’s countertop — which means the whole model runs on the assumption that freight stays cheap and trade stays open. In FY26, per the filings, neither did: tariffs on India-origin quartz rose, US buyers deferred offtake, and Red Sea shipping disruption hit the Dubai route. An industry whose entire cost advantage is “we make it cheaper and ship it” discovers, periodically, that the shipping was doing a lot of the heavy lifting.
Add a domestic quartz-countertop market still in its infancy and a heavy dependence on a handful of developed-market buyers, and the sector’s exposure to events entirely outside any single company’s control becomes the defining feature rather than a tail risk.
15. EduInvesting Verdict
| Strengths | Weaknesses |
|---|---|
| Record revenue of ₹233 Cr, up 12.3% | Operating profit turned negative; ROCE -1.62% |
| Operating cash flow positive at ₹27.5 Cr | Net worth eroded ₹60 Cr over two years |
| No promoter pledging; patented quartz tech | Dubai subsidiary a ₹392 Cr-equivalent segment loss |
| Below-book valuation at 0.63x P/B | Chairman/MD/CFO in one person; auditor changed |
| Opportunities | Threats |
|---|---|
| Loan-to-equity conversion to cut FZE finance cost | Live tax demands totalling ~₹39 Cr |
| Domestic + GCC market diversification | Export tariffs and shipping disruption |
| Bagru closure removes a loss-making unit | Two consecutive years of losses |
The tension of this entry is a single sentence: revenue has never been higher, and equity has rarely been lower, in the same year the company closed a factory and its Dubai crown jewel posted the group’s largest loss. A record top line resting on a negative operating result, with the only genuinely positive number hiding in the cash-flow statement rather than the P&L.
A company selling more stone than ever, earning less on it than ever — the volume grew, the economics didn’t.