1. At a Glance – Small Cap, Big Waves, Bigger Mood Swings
Market Cap: ₹169 Cr
Current Price: ₹55
3-Month Return: -17%
1-Year Return: -43%
ROCE: -5.07%
ROE: -8.58%
Debt: ₹62.3 Cr
TTM Sales: ₹32.20 Cr
TTM PAT: -₹5.57 Cr
Price to Book: 1.28
Welcome to the most dramatic comeback attempt in the Indian offshore services space. Global Offshore Services Ltd is currently sailing with just two operating vessels (out of 15 originally), has recently acquired a third AHTSV, and is juggling contracts worth ₹25 Cr and ₹36 Cr annualised values—while reporting a quarterly net loss of around ₹2 Cr in Q3 FY26.
Sales in the December 2025 quarter jumped to ₹12.24 Cr, up 50% YoY and 81% QoQ. Operating margin? A spicy 35.95%. But net profit? Negative ₹2 Cr. So yes, operating performance improved… but depreciation and interest still remind the company that ships are expensive toys.
Question is simple: Is this a phoenix rising from oil-crash ashes? Or a lifeboat trying to look like a cruise liner?
Let’s investigate.
2. Introduction – From Oil Crash Victim to “Garware Offshore” Rebranding Mode
Global Offshore Services was incorporated in 1976. It operates offshore support vessels—basically the Uber drivers of oil rigs.
When oil prices crashed in 2015, contracts were terminated or repriced. Revenue collapsed. Debt ballooned. The company went through restructuring and reduced net debt to under USD 2 million at one stage.
Fast forward to today.
- Borrowings were ₹37.37 Cr in Mar 2024
- Dropped to ₹29.55 Cr in Mar 2025
- Jumped back to ₹62.30 Cr by Sep 2025
Why? Because they acquired an 80 Ton BP DP2 AHTSV in June 2025 for USD 9.30 million.
Meanwhile:
- Name change approved to Garware Offshore Services Limited
- NSE re-listing application deferred to May 2026
- New CMD appointed: Aditya A. Garware (effective Nov 2025)
This company is clearly in “Act 2 of the Movie” phase. Debt is back. Assets are rising. Contracts are coming in.
But will profitability follow?
3. Business Model – WTF Do They Even Do?
Forget the PET bottle confusion in the dump. That’s clearly misplaced text. The actual business is offshore vessel chartering.
They:
- Transport crew to oil rigs
- Deliver cargo
- Perform anchor handling
- Tow rigs
- Support underwater construction
They operate:
- Platform Supply Vessels (PSV)
- Anchor Handling Tug cum Supply Vessels (AHTSV)
Current operational fleet:
- M.V. Kamet – ONGC, BG
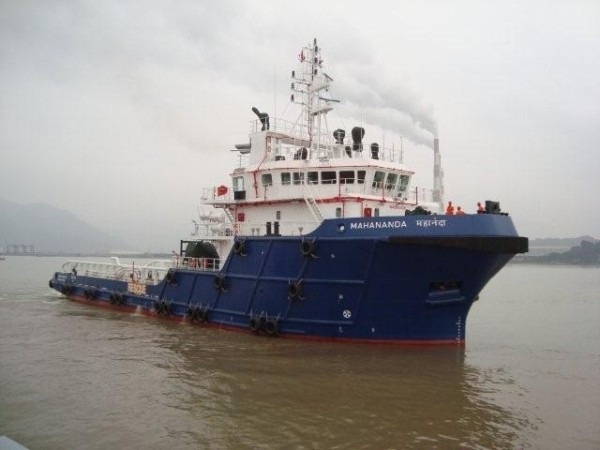
- M.V. Mahananda – BG, Vedanta
- M.V. Mahanadi – Contract starting September 2025
- One newly acquired 80 Ton AHTSV
Geographical presence:
India, Brazil, West Africa, UK, Nigeria, Angola, Thailand, Indonesia.
Client list includes:
ONGC, BP, Shell, Vedanta, Petrobras, Total Energies.
Revenue breakup FY24:
- Fleet chartering: 68%
- Fuel reimbursements: 15%
- Reversal of interest: 11%
- Debt settlement reversal: 5%
See the issue? A chunk of revenue came from financial reversals—not pure operations.
So the real question: Are they now earning from ships… or still accounting gymnastics?
4. Financials Overview
EPS:
- Q1 FY26: -0.62
- Q2 FY26: 0.06
- Q3 FY26: -0.65
Average = (-0.62 + 0.06 – 0.65) / 3 = -0.403
Annualised EPS = -0.403 × 4 = -1.61 approx
Now let’s compare:
| Metric | Latest Qtr (Dec 25) | YoY Qtr (Dec 24) | Prev Qtr (Sep 25) | YoY % | QoQ % |
|---|---|---|---|---|---|
| Revenue | 12.24 | 8.13 | 6.74 | 50.55% | 81.45% |
| EBITDA | 4.40 | 1.08 | 1.89 | 307% | 133% |
| PAT | -2.00 | 9.58 | 0.18 | -120% | -1211% |
| EPS (₹) | -0.65 | 3.64 | 0.06 | – | – |
Operating margin jumped to 35.95%. That’s impressive.
But net loss returned.
Why?
- Depreciation: ₹5.08 Cr
- Interest: ₹1.73 Cr
Ships eat profits like teenagers eat Maggi.
Now P/E?
Annualised EPS negative → No meaningful P/E.
Would you value a ship rental company on hope… or cash flows?
5. Valuation Discussion – Fair Value Range Only
Since earnings are negative, P/E method becomes theoretical.
1. P/E Method (When Profits Stabilise)
Industry median P/E: 10.94
If EPS turns to ₹5 (hypothetical stabilised scenario from contracts), valuation range = ₹50–₹60.
But current EPS is negative.
2. EV/EBITDA
EV = ₹221 Cr
TTM EBITDA = ₹5.25 Cr
EV/EBITDA = 34x
Industry peers:
- GE Shipping: 8.34 P/E
- SCI: 10.94 P/E
34x EV/EBITDA for a loss-making small fleet operator? Bold.
If EBITDA reaches ₹20 Cr sustainably, fair EV range at 8–10x = ₹160–₹200 Cr enterprise value.
3. DCF (Simplified)
Assume:
- EBITDA improves to ₹25 Cr in 3 years
- 10% discount rate
- Modest terminal growth
Implied equity value range: ₹40–₹75 per share depending on execution.
Fair Value Range (Educational): ₹40 – ₹75
This fair value range is for educational purposes only and is not investment advice.
6. What’s Cooking – Contracts, Court Cases & Rebranding Drama
Recent developments:
- ₹25 Cr annualised PSV contract (90 days, Dec 2025)
- ₹36 Cr annualised contract for M.V. Mahanadi
- Acquired AHTSV for USD 9.30 million
- UK court enforced expired $13.5M guarantee (legal appeal ongoing)
- Name change to Garware Offshore approved
- Preferential issue completed
So here’s the plot:
New ships.
New contracts.
New CMD.
New name.
But also:
Legal overhang.
Debt rising again.
Negative EPS.
Feels like interval before climax.
Are we entering the turnaround phase… or the sequel nobody asked for?
7. Balance Sheet – Latest Consolidated (Sep 2025)
| Item | Mar 2024 | Mar 2025 | Sep 2025 |
|---|---|---|---|
| Total Assets | 142.75 | 179.12 | 213.30 |
| Net Worth | 82.39 | 134.08 | 132.81 |
| Borrowings | 37.37 | 29.55 | 62.30 |
| Other Liabilities | 22.99 | 15.49 | 18.19 |
| Total Liabilities | 142.75 | 179.12 | 213.30 |
Observations:
- Assets rising due to vessel acquisition
- Debt doubled in 6 months
- Net worth stable
- Balance sheet finally breathing after 2019 disaster
But debt returning like an ex who said “I’ve changed.”
8. Cash Flow – Sab Number Game Hai
| Year | CFO | CFI | CFF |
|---|---|---|---|
| Mar 2023 | 8.12 | 64.61 | -76.84 |
| Mar 2024 | 11.78 | 81.42 | -94.39 |
| Mar 2025 | 9.41 | -10.23 | 38.85 |
Operating cash positive.
Investing cash negative in FY25 (vessel buy).
Financing positive (debt raised).
Translation: They’re borrowing to grow fleet. Classic shipping cycle behaviour.
9. Ratios – Sexy or Stressy?
| Ratio | Value |
|---|---|
| ROE | -8.58% |
| ROCE | -5.07% |
| Debt/Equity | 0.47 |
| OPM | 16.3% TTM |
| EV/EBITDA | 34x |
Margins sexy.
Returns stressy.
Valuation spicy.
Pick your adjective.
10. P&L Breakdown – Show Me the Money
| Year | Revenue | EBITDA | PAT |
|---|---|---|---|
| Mar 2023 | 51.01 | -13.35 | 382.57 |
| Mar 2024 | 39.21 | -1.16 | 37.67 |
| Mar 2025 | 32.75 | 5.80 | 3.65 |
Revenue falling for 3 years.
FY23 profit inflated by other income (₹437 Cr).
Core operations only recently stabilising.
Shipping is cyclical. But declining revenue trend is real.
11. Peer Comparison
| Company | Revenue Qtr | PAT Qtr | P/E |
|---|---|---|---|
| GE Shipping | 1454.44 | 812.52 | 8.34 |
| SCI | 1611.67 | 404.97 | 10.94 |
| SEAMEC | 317.05 | 99.76 | 18.34 |
| Global Offshore | 12.24 | -2.00 | NA |
This is not apples vs apples.
This is apple vs peanut.
Scale difference is massive.
12. Miscellaneous – Shareholding & Promoters
Latest Promoter Holding: 30.35%
Public: 68.70%
FIIs: 0.16%
DIIs: 0.78%
Promoter holding declined from 33% to 30%.
No pledges.
Aditya Ashok Garware now CMD.
Promoter roast?
30% holding means “skin in the game”… but not full captain control.
13. Corporate Governance – Angels or Devils?
- UK legal case ongoing
- Multiple preferential issues
- Name change approved
- No dividend
Interest coverage negative.
Auditors haven’t raised red flags in data shown.
But legal exposure + volatile profits = watch carefully.
14. Industry Roast – Offshore Shipping: The Most Dramatic Sector in Capital Markets
Shipping is brutally cyclical.
When oil prices rise:
Rates skyrocket.
Ships get ordered.
Everyone celebrates.
When oil crashes:
Contracts vanish.
Debt suffocates.
Banks panic.
Global Offshore was crushed in 2015.
Peers like GE Shipping survived due to scale and diversification.
Small fleet operators suffer most.
Offshore vessel supply is limited.
Day rates fluctuate violently.
If oil stays strong → contracts improve.
If oil drops → déjà vu.
And India’s offshore push via ONGC could help.
But scale matters.
Do you want to invest in the minnow… or the whale?
15. EduInvesting Verdict – Turnaround or Tide Trap?
Strengths:
- Debt drastically reduced from peak years
- New contracts worth ₹25–₹36 Cr annualised
- Operating margins improving
- Asset base expanding
Weaknesses:
- Negative TTM profit
- Low promoter holding
- High EV/EBITDA
- Legal case overhang
Opportunities:
- Offshore capex cycle revival
- Vessel acquisition strategy
- Rebranding under Garware name
Threats:
- Oil price volatility
- High depreciation burden
- Rising debt again
This is a classic high-risk turnaround small cap.
If contracts convert into consistent EBITDA, stock could justify higher valuation.
If margins slip, leverage will bite again.
It’s not a stable compounder.
It’s a high-sea gamble with a refurbished engine.
Fair value educational range remains ₹40–₹75.
This fair value range is for educational purposes only and is not investment advice.
Written by EduInvesting Team | Date