At a Glance
GHCL Textiles (GHCLTL) may not be the flashiest name in the textiles space, but Q1 FY26 proved it still knows how to weave profits. Revenue dipped 7% YoY to ₹268 Cr, yet PAT rose 14.6% to ₹13.5 Cr thanks to better cost control. Stock trades at a dirt-cheap 0.61x book value with a modest P/E of 15.2. Low promoter holding (19.2%) and lukewarm ROCE (4.5%) remain party poopers.
1. Introduction
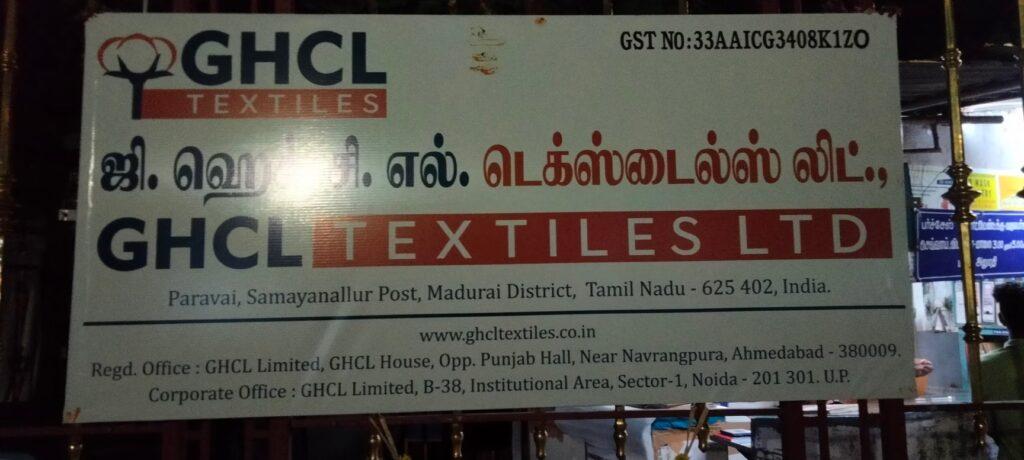
Born out of the 2020 demerger from GHCL Ltd, GHCL Textiles is trying to stitch together a growth story in a volatile yarn market. It’s an export-focused player producing premium yarns like Giza and Supima. With the Meenakshi Paravai unit ramping up and specialty yarn capacity expanding, FY26 could be the comeback year—if cotton prices behave.
2. Business Model (WTF Do They Even Do?)
- Core: Manufacturing and export of premium cotton yarns.
- Brands: GIZA, SUPIMA, Australian, CmiA.
- Customers: Export-driven, catering to high-quality garment manufacturers.
- Recent Move: Entering specialty yarns and solar-powered operations.
The model is simple—buy cotton, spin yarn, export. Margins? Dependent on cotton prices, forex, and demand.
3. Financials Overview
Q1 FY26 Numbers:
- Revenue: ₹268 Cr (-7% YoY)
- EBITDA: ₹30 Cr (margin 11%)
- PAT: ₹13.5 Cr (+14.6% YoY)
- EPS: ₹1.41
FY25:
- Revenue ₹1,141 Cr | PAT ₹58 Cr | EPS ₹6.04
Cost management and stable pricing saved profits despite lower volumes.
4. Valuation
Fair value needs stitching together:
- P/E: EPS ₹6 × 15 = ₹90
- EV/EBITDA: EBITDA ₹111 Cr × 7 = ₹777 Cr (per share ~₹81)
- DCF: Conservative fair range ₹85 – ₹105
Fair Value Range: ₹85 – ₹105
CMP ₹92 sits exactly where it should.
5. What’s Cooking – News, Triggers, Drama
- Capex: ₹11.25 Cr approved for solar and specialty yarn.
- New Unit: Meenakshi (Paravai) unit commenced trial production.
- Export Demand: Moderate recovery in key markets.
- Promoter Holding: Stuck at 19.2%—not ideal.
6. Balance Sheet
| (₹ Cr) | FY23 | FY24 | FY25 |
|---|---|---|---|
| Assets | 1,633 | 1,703 | 1,703 |
| Liabilities | 266 | 202 | 202 |
| Net Worth | 1,367 | 1,418 | 1,418 |
| Borrowings | 72 | 63 | 63 |
Remark: Debt is minimal; net worth stable.
7. Cash Flow – Sab Number Game Hai
| (₹ Cr) | FY23 | FY24 | FY25 |
|---|---|---|---|
| Operating | 0 | 58 | 162 |
| Investing | 0 | -33 | -154 |
| Financing | 0 | -14 | -16 |
Commentary: FY25 saw healthy operating cash, reinvested into capacity.
8. Ratios – Sexy or Stressy?
| Ratio | FY23 | FY24 | FY25 |
|---|---|---|---|
| ROE | — | 4% | 4% |
| ROCE | — | 6% | 5% |
| P/E | — | — | 15x |
| PAT Margin | — | 5% | 5% |
| D/E | — | 0.05 | 0.04 |
Verdict: Ratios are lukewarm; company needs margin expansion.
9. P&L Breakdown – Show Me the Money
| (₹ Cr) | FY23 | FY24 | FY25 |
|---|---|---|---|
| Revenue | — | 1,054 | 1,141 |
| EBITDA | — | 84 | 111 |
| PAT | — | 25 | 58 |
Commentary: FY25 profits doubled; Q1FY26 holds momentum.
10. Peer Comparison
| Company | Revenue (₹ Cr) | PAT (₹ Cr) | P/E |
|---|---|---|---|
| KPR Mill | 6,388 | 797 | 49 |
| Vardhman Textiles | 9,862 | 852 | 15 |
| Welspun Living | 10,545 | 639 | 20 |
| GHCL Textiles | 1,141 | 58 | 15 |
Commentary: Trades cheap but lacks peers’ scale and margins.
11. Miscellaneous – Shareholding, Promoters
- Promoters: 19.2% (low, risky)
- FIIs: 15.7% (falling)
- DIIs: 6.1%
- Public: 59% (high retail ownership)
High public holding means volatility is here to stay.
12. EduInvesting Verdict™
GHCL Textiles Q1 FY26 is a mixed bag: profits improved but revenue slipped. Low promoter holding is a structural weakness, and ROCE is uninspiring. Yet, strong cash flows, low debt, and upcoming capacity could turn the tide if demand picks up.
SWOT Snapshot:
- Strengths: Debt-free, export market, strong product mix.
- Weaknesses: Low promoter stake, weak margins.
- Opportunities: Specialty yarn, solar-driven cost savings.
- Threats: Cotton price volatility, global demand risks.
At ₹92, GHCL Textiles looks fairly priced but needs more growth to attract serious investors.
Written by EduInvesting Team | 29 July 2025
SEO Tags: GHCL Textiles, Q1 FY26, Textile Industry Analysis

