GE Vernova T&D India Ltd FY26: Operating Leverage Explodes as EBITDA Margins Hit 27% On 4.5x Order Book Scale
Section 1 — At a Glance
GE Vernova T&D India Ltd delivered an exceptional operational turnaround in FY26, with revenue climbing 44.6% to ₹6,206.31 crore and net profit scaling 102.7% to ₹1,233.25 crore. The structural upshift in India’s power transmission landscape—accelerated by bulk green energy evacuation requirements—has transformed this once-subdued capital goods player into a high-margin powerhouse. The market has aggressively priced this transformation, driving the stock to a trailing Price-to-Earnings (P/E) multiple of 97.1x.
Investor enthusiasm is primarily anchored to the company’s exploding order backlog, which crossed ₹14,380 crore by December 2025, representing nearly 2.5x its historical revenue run-rate. Operating profit margins (OPM) reached a lifetime high of 27.1% for the full year , driven by operating leverage, structural price increases, and a highly profitable mix of export contracts. Furthermore, the balance sheet has transitioned into an absolute fortress, boasting zero debt and a massive cash balance of ₹1,527.72 crore.
However, terminal valuations leave zero room for execution friction. While the company’s backlog composition has been heavily de-risked—with state utilities accounting for less than 2% of total orders —execution risks remain closely tied to Right-of-Way (ROW) clearances and customer-side civil engineering delays. In capital goods cycles, structural margin expansion is rarely a linear trajectory; peak capacity utilization and raw material price volatility can trigger sudden run-rate stabilization. This analysis explores whether GE Vernova T&D’s operating model can structurally sustain its newfound profitability, or if the market is treating a cyclical zenith as a permanent growth rate.
Section 2 — Introduction
GE Vernova T&D India Ltd occupies a critical choke-point in India’s electrical infrastructure grid. As the listed Indian arm of GE Vernova’s global Grid Solutions business , the company has spent over a century engineering the hardware and digital systems that evacuate high-voltage power from generation sources to the national grid. Over the last decade, the entity has weathered intense domestic capital expenditure contractions, structural reorganizations, and promoter stake sales, emerging as a pure-play beneficiary of the ongoing energy transition.
The stock has captured institutional attention following a massive corporate cleanup and a subsequent operational liftoff. In late 2024, the company officially rebranded to incorporate the “Vernova” moniker , aligning with the global spin-off of GE’s energy portfolio. Shortly before this, in September 2024, promoter entities executed a multi-crore Offer for Sale (OFS) , reducing their stake from 75% to 59% (and later to 51% by March 2026 ) to meet minimum public shareholding norms and fund global alignments. This article evaluates the company’s performance following its Q4FY26 earnings release, analyzing its high-voltage product mix, structural cash metrics, and forward valuation ranges.
Section 3 — Business Model: WTF Do They Even Do?
Strip away the corporate jargon, and GE Vernova T&D is essentially a premium blacksmith for the electrical superhighway. When an industrial giant or a central utility sets up a massive solar park in Rajasthan or an ultra-heavy manufacturing plant, they cannot plug directly into regular power lines. They require ultra-high voltage equipment to step up, control, switch, and step down hundreds of kilovolts without blowing up the grid.
The company designs and manufactures the physical monsters of the power world: massive power transformers, circuit breakers, gas-insulated switchgears (GIS), and substation automation systems ranging from 66 kV to ultra-high-voltage 1,200 kV networks.
The business model is split across two core vectors:
Heavy Hardware (Products & Turnkey Solutions): Building physical substations and heavy transmission machinery, increasingly led by High Voltage Direct Current (HVDC) systems.
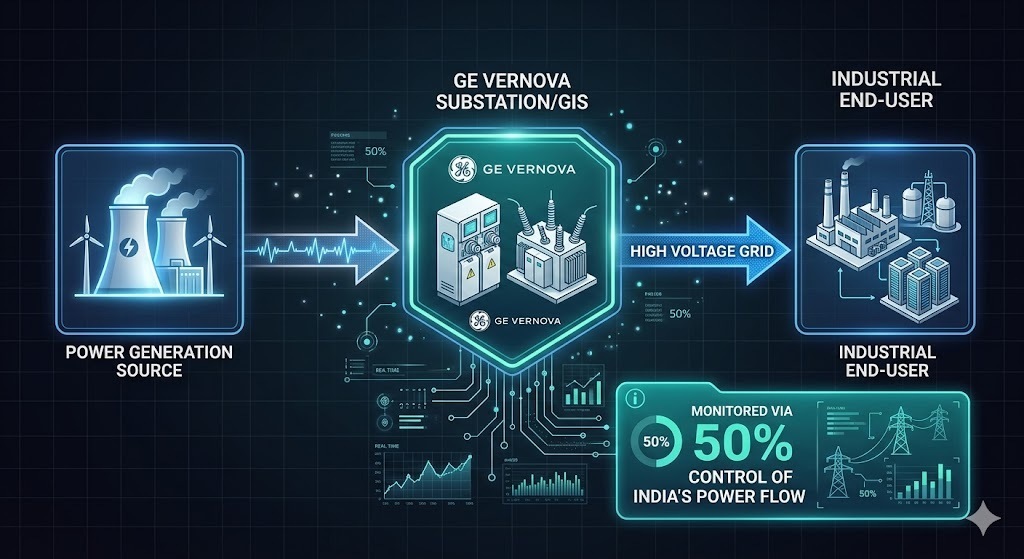
Digital Intelligence (Software & Services): Providing the brains of the operation. Approximately 50% of India’s entire power flow is monitored using digital control software designed by this company.
Financially, management has successfully altered its revenue mix to maximize profitability. Product sales have expanded to approximately 40% of revenues , reducing reliance on low-margin, execution-heavy turnkey construction contracts. Geographically, the company uses its Indian manufacturing base as a global export hub , routing over 31% of its output to high-margin international markets spanning over 75 countries.
Section 4 — Financials Overview
Figures are standalone, in ₹ crore.
The company’s quarterly trajectory highlights a profound operational acceleration, with top-line growth driving immediate bottom-line leverage.
Quarterly Performance Trend
Metric
Latest Quarter (Mar 2026)
YoY Change (%)
QoQ Change (%)
Revenue
₹1,637.08
+42.0%
-3.7%
EBITDA / Operating Profit
₹444.94
+76.5%
-2.1%
PAT (Net Profit)
₹351.77
+88.7%
+21.0%
EPS (₹)
₹13.74
+88.7%
+21.0%
QUARTERLY REVENUE TRAJECTORY (₹ Crore) Dec 2024: 1,073.65 Mar 2025: 1,152.54 Jun 2025: 1,330.13 Sep 2025: 1,538.46 Dec 2025: 1,700.64 Mar 2026: 1,637.08
What is Management Promising in the Coming Quarters?
The February and May 2026 management interactions indicate that the corporate underwriting strategy has fundamentally shifted from