At a Glance
Great Eastern Shipping (GES) – India’s oldest private shipping giant – reported Q1 FY26 PAT at ₹504 Cr, down 32% YoY, because even ships slow down in rough seas. Revenue sank to ₹1,201 Cr (-20% YoY), and management is probably lighting candles to the gods of freight rates. Dividend hunters, rejoice! A ₹7.2 interim dividend was announced because who needs capex when you have cash to throw around? The stock trades at P/E of just 8x, screaming “value” louder than a distressed cargo vessel. But beware, the tide of offshore drilling and shipping rates can flip faster than oil prices.
Introduction
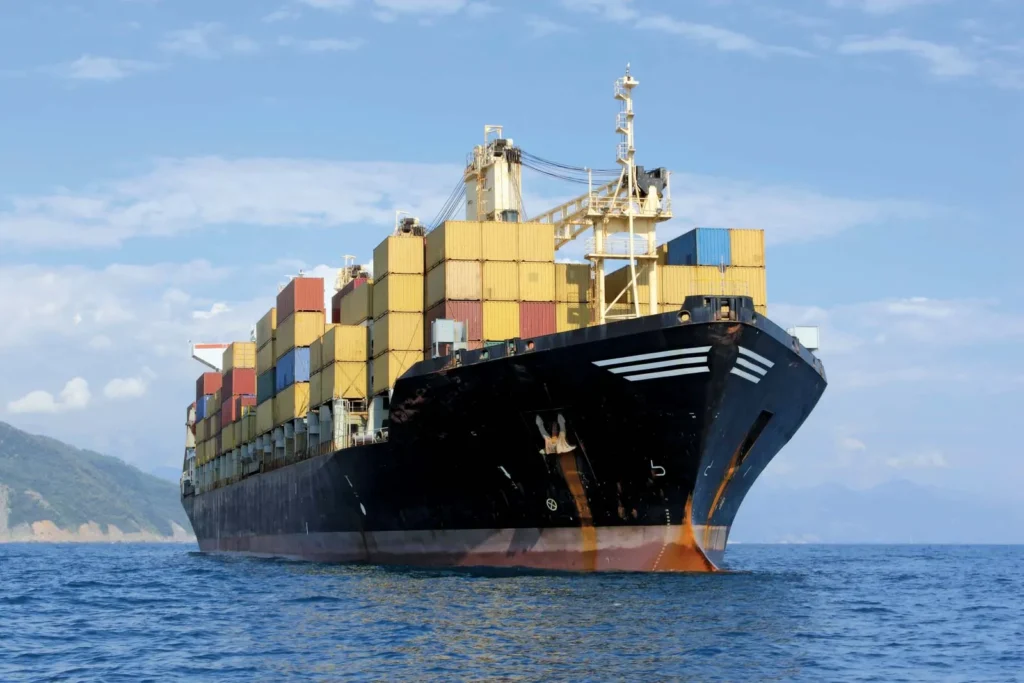
Picture this: a company founded in 1948, surviving wars, oil shocks, and multiple “India Shining” campaigns. That’s GES. While others were building apps, these folks were still sailing metal beasts and renting rigs to oil companies. Q1 FY26 numbers? Profits dipped 32%, revenue slipped 20%, and investors collectively asked, “Wasn’t shipping supposed to be booming?” Turns out, global freight rates crashed harder than your crypto portfolio in 2022.
Still, GES remains India’s shipping kingpin with a ₹13,445 Cr market cap, a fleet of 43 ships, and 23 offshore assets. And with debt reducing faster than your enthusiasm for Monday mornings, the balance sheet is surprisingly robust. The only red flag? Sales growth is as exciting as an empty harbor.
Business Model (WTF Do They Even Do?)
GES does three things:
- Shipping: Owns & operates crude, product, and gas carriers. Basically, they move stuff you can’t carry in your car trunk.
- Offshore Drilling: Provides rigs and support vessels to oil companies because oil doesn’t drill itself.
- Chartering: Rents out ships to whoever pays, from IOC to random global traders.
Revenue split is heavily dependent on shipping, which means they live and die by global freight rates. Think of GES as that friend who makes a killing when oil is expensive and sulks when it’s cheap.
Financials Overview
- Q1 FY26 Revenue: ₹1,201 Cr (↓20% YoY)
- Operating Profit (OPM): ₹643 Cr (54% margin, yes still juicy)
- PAT: ₹504 Cr (↓32% YoY)
- EPS: ₹35.34 vs ₹56.87 (YoY crash alert)
Annualized EPS = ₹35.34 × 4 = ₹141.36
At CMP ₹940, fresh P/E = 6.6x (way below sector average). Cheap or value trap? You decide.
Commentary: GES runs on oil and luck. When oil is volatile, so is their revenue. The Q1 drop reflects softer day rates and lower fleet utilization.
Valuation
We calculate fair value using 3 methods:
- P/E Valuation:
- Sector P/E avg ≈ 10x
- Fair Value = 141 × 10 = ₹1,410
- EV/EBITDA:
- FY25 EBITDA ≈ ₹2,677 Cr
- EV/EBITDA avg 6x → EV ≈ ₹16,000 Cr
- Less debt ₹2,163 Cr → Equity ≈ ₹13,800 Cr
- FV per share ≈ ₹965
- DCF (simplified):
- Assume FCF ~₹2,000 Cr, growth 3%, WACC 10% → FV ≈ ₹1,200
🎯 Fair Value Range: ₹965 – ₹1,410
What’s Cooking – News, Triggers, Drama
- Dividend: ₹7.2 interim.
- Debt reduction: Borrowings cut to ₹2,163 Cr (vs ₹3,048 Cr).
- Oil market volatility: Rates down = earnings down.
- Triggers: Higher crude demand, offshore drilling contracts, and global freight rates rebounding.
Balance Sheet
| (₹ Cr) | FY25 |
|---|---|
| Assets | 17,656 |
| Liabilities | 3,396 |
| Net Worth | 14,259 |
| Borrowings | 2,163 |
Remark: Debt fell faster than a sinking dinghy. Net worth solid; assets still earning their keep.
Cash Flow – Sab Number Game Hai
| (₹ Cr) | FY23 | FY24 | FY25 |
|---|---|---|---|
| Ops | 2,975 | 2,808 | 2,647 |
| Investing | 39 | -868 | -148 |
| Financing | -1,893 | -1,330 | -1,675 |
Remark: Healthy operating cash, conservative investments, and financing outflows (dividends + debt repayment) – CFOs sleep peacefully.
Ratios – Sexy or Stressy?
| Metric | FY25 |
|---|---|
| ROE | 14% |
| ROCE | 14% |
| P/E | 6.6x |
| PAT Margin | 40%+ |
| D/E | 0.15 |
Remark: Ratios are beach-body ready: low debt, good margins. Only sales growth flunks.
P&L Breakdown – Show Me the Money
| (₹ Cr) | FY23 | FY24 | FY25 |
|---|---|---|---|
| Revenue | 5,690 | 5,255 | 5,323 |
| EBITDA | 3,128 | 3,022 | 2,677 |
| PAT | 2,575 | 2,614 | 2,344 |
Remark: Revenue stagnant, PAT declining. Still better margins than your local kirana.
Peer Comparison
| Company | Rev (₹ Cr) | PAT (₹ Cr) | P/E |
|---|---|---|---|
| GE Shipping | 5,323 | 2,344 | 6.6 |
| SCI | 5,606 | 844 | 11.9 |
| SEAMEC | 652 | 74 | 27.3 |
| Transworld | 446 | 45 | 13.0 |
Remark: Cheapest P/E, best PAT margins – market is either blind or expects stormy seas.
Miscellaneous – Shareholding, Promoters
- Promoter Holding: 30.08% (rock steady)
- FIIs: 24.6%
- DIIs: 15.1%
- Public: 30.1%
Promoters (Sheths) have been steering this ship for decades, surviving downturns. No major M&A buzz – they prefer sailing calm waters.
EduInvesting Verdict™
GES is like that old warship: sturdy, underpriced, and still firing cannons. The numbers show a temporary slowdown – freight rates are down, profits have slipped, and the stock is stuck under book value. But:
- Strengths: Strong balance sheet, low debt, fat margins, steady dividends.
- Weakness: Sales growth is missing; offshore drilling is cyclical.
- Opportunities: Oil & gas exploration boom, charter rate recovery.
- Threats: Global slowdown, rate crashes, regulatory hurdles.
Verdict: GES is a value play for patient investors. For traders, it’s a tide game – ride the waves or get washed out.
Written by EduInvesting Team | 31 July 2025Tags: Great Eastern Shipping, Shipping Stocks, Q1 FY26 Results, Maritime Industry


