1. At a Glance
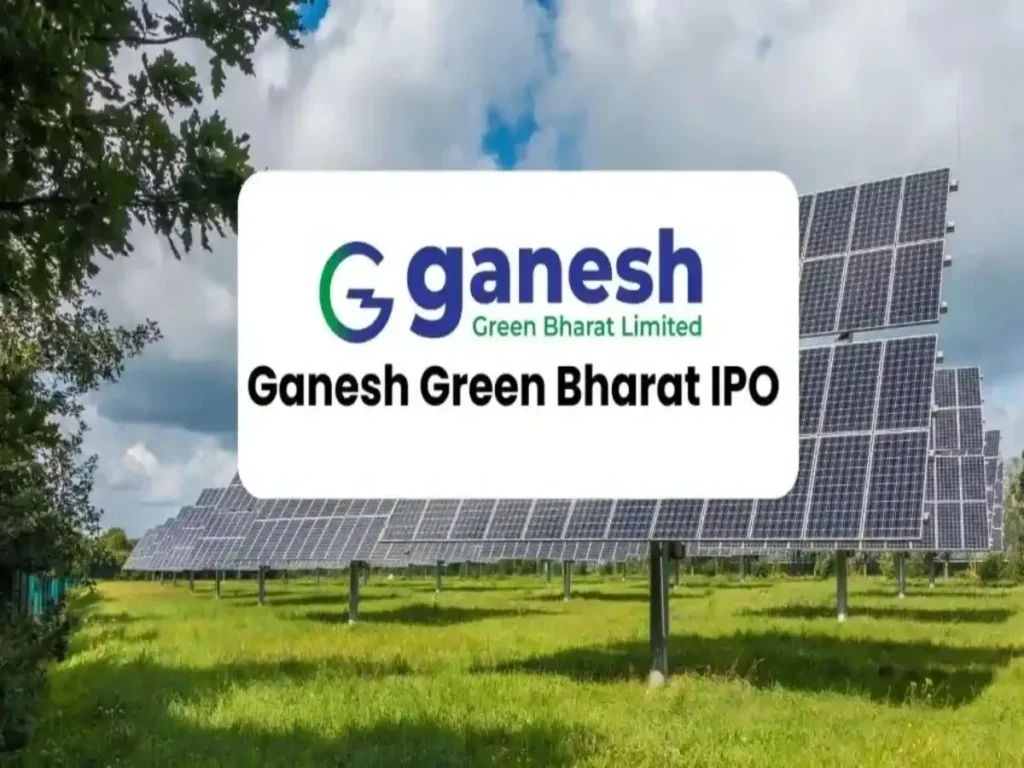
Ganesh Green Bharat Ltd (GGBL) is a smallcap EPC & solar equipment company that just dropped an 87% YoY revenue jump in FY25 and claims to be cooking a 1.1 GW solar module facility. But with zero dividends, rising inventory days, and ambitious capex plans, is this really Green Gold—or just Green Gamble?
2. Introduction with Hook
Imagine a Gujarati startup meets Ambuja Cement’s discipline, adds NTPC-sized orders, and then chucks all the profit into capex like it’s playing Monopoly. That’s GGBL.
- FY25 Revenue: ₹318 Cr (vs ₹170 Cr in FY24)
- Order Book: ₹1124 Cr as of June 2025
- Solar capacity: 750 MW operational, expanding to 1.1 GW by Aug 2025
This is no sleepy PSU—GGBL is India’s hyper-growth, rooftop-hugging, subsidy-sniffing solar EPC dynamo.
3. Business Model (WTF Do They Even Do?)
GGBL operates in three verticals:
- Solar PV Module Manufacturing – BIS certified, expanding capacity aggressively.
- EPC Projects – B2B contracts with giants like NTPC, Solberry Energy.
- Water Supply + Electrical Infra – Niche, state-funded infra projects (50,000+ water connections in 14 states).
What makes them different?
- Fully backward integrated module line
- Dual strategy: government EPC + B2C rooftop market
- Unabashedly growth-obsessed
4. Financials Overview
| Metric | FY23 | FY24 | FY25 |
|---|---|---|---|
| Revenue | ₹90 Cr | ₹170 Cr | ₹318 Cr |
| EBITDA | ₹14 Cr | ₹35 Cr | ₹47 Cr |
| Net Profit | ₹8 Cr | ₹22 Cr | ₹30 Cr |
| EPS | ₹68 | ₹10.9 | ₹12.2 |
| ROE | 27% | 23% | 23% |
Important: FY23 EPS was on pre-split equity; post IPO, equity capital expanded from ₹1 Cr to ₹25 Cr, hence EPS normalized.
5. Valuation
Method 1: PE-Based Valuation
- EPS (TTM): ₹12.2
- Fair PE for solar EPC: 30–40x
- FV Range: ₹366 – ₹488
Method 2: Order Book Multiple
- ₹1124 Cr order book, 18–24 months execution
- 10% PAT margin → ₹112 Cr profit potential
- Market Cap today = ₹1,337 Cr
- Implied 12x forward PE
Current Price = ₹539
Conclusion: Slightly overheated in short term, but not outrageous if execution continues.
6. What’s Cooking – News, Triggers, Drama
- June 2025: FY25 revenue up 87%, order book crosses ₹1124 Cr
- Feb 2025: ₹33 Cr NTPC rooftop order
- Jan 2025: ₹79 Cr 50MW order from Solberry Energy
- Dec 2024: ₹5.5 Cr capex to expand capacity to 1.1 GW
- B2C Rooftop Entry: Company says hello to middle-class India and subsidy hunters
GGBL is going from a sleepy EPC player to solar’s version of Adani in miniature.
7. Balance Sheet
| FY | Equity | Reserves | Borrowings | Total Liabilities | Fixed Assets | Other Assets |
|---|---|---|---|---|---|---|
| FY23 | ₹1 Cr | ₹34 Cr | ₹27 Cr | ₹88 Cr | ₹2 Cr | ₹86 Cr |
| FY24 | ₹18 Cr | ₹39 Cr | ₹54 Cr | ₹150 Cr | ₹21 Cr | ₹129 Cr |
| FY25 | ₹25 Cr | ₹180 Cr | ₹48 Cr | ₹339 Cr | ₹48 Cr | ₹290 Cr |
Key Takeaways:
- Clean equity raise (probably IPO) boosted net worth
- Debt flat despite 2x+ revenue: disciplined leverage
- Asset base scaled with execution
8. Cash Flow – Sab Number Game Hai
| FY | Operating CF | Investing CF | Financing CF | Net CF |
|---|---|---|---|---|
| FY23 | ₹-2 Cr | ₹-0 Cr | ₹3 Cr | ₹-0 Cr |
| FY24 | ₹0 Cr | ₹-10 Cr | ₹10 Cr | ₹0 Cr |
| FY25 | ₹-29 Cr | ₹-48 Cr | ₹107 Cr | ₹30 Cr |
Narrative:
- Cash from ops = weak due to WC stress
- Capex + Working capital = huge drain
- Financed smartly through IPO + borrowings
Not ideal for dividend seekers. But growth-first investors? This is your poison.
9. Ratios – Sexy or Stressy?
| Ratio | FY23 | FY24 | FY25 |
|---|---|---|---|
| ROCE | 24% | 39% | 25% |
| ROE | 27% | 23% | 23% |
| Debtor Days | 81 | 87 | 65 |
| Inventory Days | 99 | 128 | 175 |
| CCC (Cash Conversion) | 57 | 125 | 164 |
| PE (TTM) | — | — | 44 |
Conclusion:
- CCC getting worse, may affect cash flows
- ROCE remains strong = earnings quality okay
- Inventory pile-up? Could be raw material stocking for large orders
10. P&L Breakdown – Show Me the Money
| FY | Sales | OPM % | Net Profit | EPS |
|---|---|---|---|---|
| FY23 | ₹90 Cr | 15% | ₹8 Cr | ₹68 (Pre IPO) |
| FY24 | ₹170 Cr | 21% | ₹22 Cr | ₹10.9 |
| FY25 | ₹318 Cr | 15% | ₹30 Cr | ₹12.2 |
Margin compression in FY25 is worth noting despite sales doubling. Execution strain?
11. Peer Comparison
| Company | CMP | PE | ROE | OPM | Sales | Market Cap |
|---|---|---|---|---|---|---|
| Techno Electric | ₹1,544 | 47 | 12.8% | 14.9% | ₹2,268 Cr | ₹17,979 Cr |
| KEC Intl | ₹872 | 40 | 12.1% | 6.9% | ₹21,846 Cr | ₹23,206 Cr |
| NBCC | ₹113 | 50 | 25.9% | 5.2% | ₹12,038 Cr | ₹30,518 Cr |
| Ganesh Green | ₹539 | 44 | 23.0% | 14.9% | ₹318 Cr | ₹1,337 Cr |
Despite its smaller size, GGBL competes on margins. But scale risk is very real.
12. Miscellaneous – Shareholding, Promoters
| Quarter | Promoter | FII | DII | Public |
|---|---|---|---|---|
| Mar 2025 | 73.4% | 1.5% | 1.0% | 24.1% |
Highlights:
- Public holding rising = retail interest exploding
- FII/DII showing exit signs = valuation fatigue?
- Shareholders increased from 4,308 → 5,607 in 6 months
Still tightly held, but watch out for post-lock-in volatility.
13. EduInvesting Verdict™
Ganesh Green Bharat Ltd is not your average EPC player. It’s more like a Green Tesla meets Adani-lite on a caffeine high.
Why it excites us:
- 1.1 GW capacity in sight
- Massive 3.5x order book vs sales
- Solar + EPC + B2C = diversified growth engine
- ROCE & ROE consistently >20%
Why it scares us:
- Valuation stretched at 44x PE
- CCC ballooning
- Operating cash negative
- No dividend even in FY25
Final Thought:
GGBL is a classic “solar upstart meets infra mafia” story—young, capital-hungry, and riding policy tailwinds. But remember: when sun sets, shadows grow longer. Choose your entry like you’d choose your sunscreen—SPF 50 minimum.
Metadata
– Written by EduInvesting Research | 14 July 2025
– Tags: GaneshGreen, SolarCapex, SMEIPO, EPCProjects, GreenInfra, RooftopSolar, MicrocapEnergy


