1. At a Glance
Fedfina, Federal Bank’s retail-focused NBFC child, runs a neat three-item menu: mortgage loans, gold loans, and secured business loans. It has one of the lowest borrowing costs in its peer set (9%) but still rocks a debt-to-equity of 4.1. Sales up 23.5% in FY25, PAT up 6.8% last quarter, but ROE is stuck under 10%. Share price has sprinted ~50% in the last 6 months — clearly the market loves a leveraged charmer.
2. Introduction
In a country where gold is religion, property is obsession, and small business owners live on loan rollovers, Fedfina has found its sweet spot. Backed by Federal Bank (61% promoter holding), it lends money mostly against things it can seize if you ghost them — gold chains, family homes, or shop premises.
Its selling point? Cost of funds that’s almost as low as the smile on a PSU banker’s face. Yet, it’s not exactly a profit monster — ROA is just 1.85%, and cost-to-income ratio sits at 58.6%, meaning for every ₹100 it earns, ₹59 is eaten by expenses before taxman even enters the chat.
3. Business Model (WTF Do They Even Do?)
Core Lending Segments (Q2 FY25 AUM mix):
- Mortgage Loans(50.5% of AUM): ₹7,175 Cr, avg ticket ₹31.7 lakh, yield 13.3%.
- Gold Loans(34.7% of AUM): ₹4,934 Cr, avg ticket ₹1.2 lakh, yield 15.8%.
- Business Loans(13.6% of AUM): ₹1,932 Cr, avg ticket ₹23.4 lakh, yield 16.9%.
Geography:665 branches across 18 states/UTs, South India dominant (44.2% of AUM), then West (34.6%), North (21.2%).
Their edge? Secured lending with 86.4% AUM backed by collateral. Their weakness? Low interest coverage (1.36) — that’s like having rent just ₹500 less than your monthly salary.
4. Financials Overview
| Metric | Latest Qtr (₹ Cr) | YoY Qtr (₹ Cr) | Prev Qtr (₹ Cr) | YoY % | QoQ % |
|---|---|---|---|---|---|
| Revenue | 520 | 477 | 536 | 9.02% | -2.99% |
| EBITDA* | 112 | 91 | 111 | 23.08% | 0.90% |
| PAT | 75 | 70 | 72 | 7.14% | 4.17% |
| EPS (₹) | 2.01 | 1.89 | 1.92 | 6.35% | 4.69% |
*Here “EBITDA” = financing profit before other income & depreciation for NBFC context.
P/E= 135 ÷ 6.17 =21.88(in line with industry median ~22).
5. Valuation (Fair Value RANGE only)
Method 1 – P/EAssume fair P/E = 18–22 (given mid-tier ROE).FV = EPS ₹6.17 × 18 to 22 = ₹111 – ₹136
Method 2 – P/BCurrent BV = ₹68.4; fair range P/B = 1.6–1.9 → FV = ₹109 – ₹130
Method 3 – DDM(assuming 15% growth, 12% cost of equity, 20% payout long term) → FV ≈ ₹115 – ₹140
Fair Value Range: ₹109 – ₹140Disclaimer: This FV range is for educational purposes only and is not investment advice.
6. What’s Cooking – News, Triggers, Drama
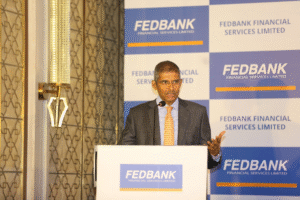
- New MD & CEO: Parvez Mulla (ex-HDFC Bank, SBI Cards) took charge in Oct 2024 — fresh playbook incoming.
- NCD Issue:


