1. At a Glance
Cleanroom crusader Fabtech went from obscure modular pharma vendor to ₹533 Cr SME stock darling in 2025. Riding on pharma infra tailwinds and order wins, it delivered ₹150 Cr revenue and ₹13 Cr PAT in FY25. Trading at a PE of 40.1 with 21% ROCE and practically no debt.
2. Introduction with Hook
Imagine if IKEA built operating theatres. Fabtech Technologies does exactly that — minus the hex keys and frustration. They build modular, regulatory-grade cleanrooms that turn dusty sheds into pharma-grade sterile temples.
The result?
- 130% TTM profit growth
- 21% ROCE, 18.2% ROE
- ₹85 Cr order book with Q1FY26 revenue up 32% YoY
Clean margins, clean balance sheet, cleanroom play. But how clean is the valuation?
3. Business Model (WTF Do They Even Do?)
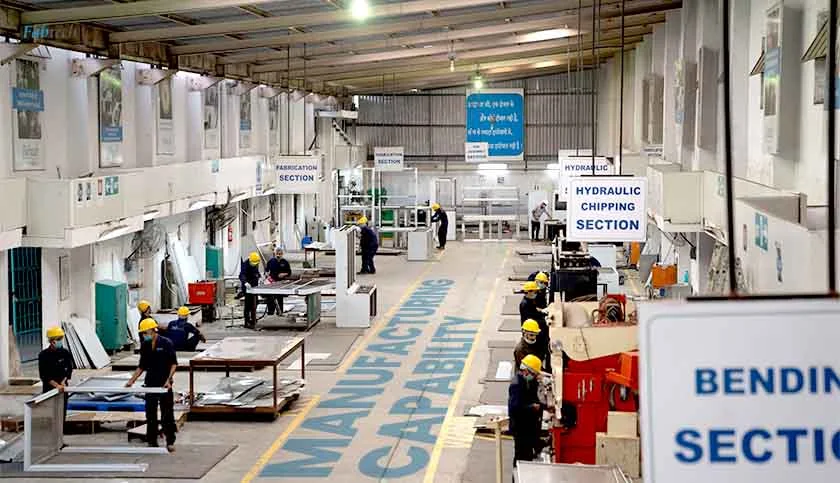
Fabtech builds cleanrooms and modular infrastructure for:
- Pharma Manufacturing
- Biotech R&D
- Hospitals & ICUs
- Global Exports adhering to FDA, ISO, WHO-GMP norms
Services offered:
- Turnkey solutions: Design → Manufacture → Install → Validate
- Modular Panels, Doors, Laminar Flow Units
- HVAC & electrical integrations for sterile environments
They’re the guys who make sure your COVID vaccine didn’t get made in a warehouse with pigeons.
4. Financials Overview
| Year | Revenue (Cr) | EBITDA (Cr) | PAT (Cr) | OPM % | EPS (₹) |
|---|---|---|---|---|---|
| FY23 | ₹125 | ₹13 | ₹8 | 10% | 28.57 |
| FY24 | ₹97 | ₹9 | ₹6 | 9% | 20.75 |
| FY25 | ₹150 | ₹16 | ₹13 | 11% | 10.80 |
EPS seems confusing due to equity expansion post-IPO. Actual profit growth is 60%+ YoY. Margin improving. PE expanding.
5. Valuation
- Current Price: ₹433
- EPS FY25: ₹10.80
- P/E: 40.1x
- Book Value: ₹76.6 → P/B = 5.65
- Peer P/E Avg: 50–60x (Kaynes, Syrma SGS)
Fair Value Range: ₹320–₹460
If they double FY26 PAT (plausible with ₹85 Cr OB), PE compresses and story becomes even more attractive.
6. What’s Cooking – News, Triggers, Drama
- June ’25 Orders: ₹11.5 Cr
- Q1FY26 Revenue: ₹43.2 Cr (vs ₹32.7 Cr YoY)
- Order Book: ₹85.08 Cr — >50% of FY25 sales already secured
- IPO Freshness: Recently listed, retail + SME buzz
- Promoter Holding Dropped: Down 24.7% last quarter (red flag?)
- Large FII + DII Entry: DIIs at 11.2%, FIIs 0.69%
This one’s in accumulation mode — or maybe “pre-mania” phase.
7. Balance Sheet
| Metric | FY23 | FY24 | FY25 |
|---|---|---|---|
| Equity Capital | ₹3 Cr | ₹3 Cr | ₹12 Cr |
| Reserves | ₹43 | ₹49 | ₹82 |
| Borrowings | ₹6 | ₹6 | ₹1 |
| Other Liabilities | ₹29 | ₹32 | ₹28 |
| Fixed Assets | ₹4 | ₹5 | ₹4 |
| Investments | ₹0 | ₹1 | ₹27 |
| Total Assets | ₹81 | ₹89 | ₹124 |
Highlights:
- Nearly debt-free
- Investments shot up (likely from IPO proceeds)
- Lean, mean asset-light machine
8. Cash Flow – Sab Number Game Hai
| Cash Flow Type | FY23 | FY24 | FY25 |
|---|---|---|---|
| Operating Cash Flow | ₹8 Cr | ₹3 Cr | ₹3 Cr |
| Investing Cash Flow | ₹-3 Cr | ₹-2 Cr | ₹-26 Cr |
| Financing Cash Flow | ₹-4 Cr | ₹-1 Cr | ₹24 Cr |
| Net Cash Flow | ₹1 Cr | ₹0 Cr | ₹1 Cr |
Readout:
IPO proceeds parked as investments. Operational cash flow consistent. No funny leverage stuff.
9. Ratios – Sexy or Stressy?
| Ratio | FY23 | FY24 | FY25 |
|---|---|---|---|
| ROCE % | 26% | 16% | 21.1% |
| ROE % | 28.5%* | 18% | 18.2% |
| Debtor Days | 144 | 193 | 129 |
| Inventory Days | 57 | 88 | 67 |
| Payable Days | 82 | 122 | 74 |
| CCC (Days) | 119 | 159 | 122 |
Takeaway: Efficient ops, good returns. Only watch: debtor days in FY24 were bloated but corrected in FY25.
10. P&L Breakdown – Show Me the Money
| Year | Sales (Cr) | EBITDA (Cr) | PAT (Cr) | EPS (₹) | OPM % |
|---|---|---|---|---|---|
| FY23 | ₹125 | ₹13 | ₹8 | 28.57 | 10% |
| FY24 | ₹97 | ₹9 | ₹6 | 20.75 | 9% |
| FY25 | ₹150 | ₹16 | ₹13 | 10.80 | 11% |
EPS appears lower in FY25 due to 4x equity base post-IPO. Real profits doubled. Reality check: financial performance is better than it looks.
11. Peer Comparison
| Company | P/E | ROCE % | Revenue (Cr) | PAT (Cr) | MCap (Cr) |
|---|---|---|---|---|---|
| Kaynes Tech | 137.5 | 14.4 | 2,722 | 293 | ₹40,352 |
| Syrma SGS | 70.6 | 12.4 | 3,787 | 171 | ₹12,101 |
| Fabtech Cleanroom | 40.1 | 21.1 | 150 | 13 | ₹533 |
Fabtech is the baby in the room, but with better margins and no debt — an SME player with midcap dreams.
12. Miscellaneous – Shareholding, Promoters
| Category | Mar ’25 Holding |
|---|---|
| Promoters | 68.41% |
| FIIs | 0.69% |
| DIIs | 11.24% |
| Public | 19.66% |
| Total SHs | 349 |
Notable:
- Promoter stake dropped ~25% in recent quarter — maybe pre-IPO restructuring?
- Strong DII interest post listing. One to watch.
13. EduInvesting Verdict™
Fabtech is the cleanroom equivalent of a stealth bomber — silent, precise, and suddenly on everyone’s radar.
Margins are healthy, debt is dead, ROCE is sexy, and the business model is globally relevant. But concerns exist:
- Order book still small vs market cap
- Promoter dilution not explained
- Revenue growth needs to keep up with valuations
That said, if you want a “specialty infra + pharma hygiene + modular capex” cocktail in your portfolio, Fabtech’s sipping smooth.
It’s not your typical EPC — it’s pharma’s interior designer.
Metadata
– Written by EduInvesting Research | July 15, 2025
– Tags: Fabtech Technologies, Cleanroom Stocks, SME IPO, Modular Infrastructure, Pharma Capex, Healthcare Infra, High ROCE Stocks
