1. At a Glance
Eternal Ltd (aka Zomato) is living proof that in India, if your app brings samosas faster than your neighbour’s maid, the market will value you at ₹3,07,267 crore — even if your net profit is a polite ₹299 crore. P/E? A meme-worthy1,028×on trailing EPS. This is not valuation; this is a stock market food festival where logic isn’t invited. Sales have exploded 70% YoY in the June quarter, but profits plunged 90% QoQ because margins apparently went on a diet.
2. Introduction
Founded in 2010, Zomato started as your friendly restaurant discovery portal and now runs amulti-segment food-tech empire— food delivery, dining-out, B2B restaurant supplies (Hyperpure), quick commerce (Blinkit), and now event ticketing after swallowing Paytm Insider.
In FY22, food delivery was 81% of the pie; by H1 FY25, it’s down to 44% as Blinkit (quick commerce) and Hyperpure gobble market share like pav bhaji at midnight. Quick commerce is the new star, growing 136% YoY. Blinkit promises deliveries in 15 minutes, which is faster than most listed companies reply to SEBI notices.
Hyperpure, Zomato’s B2B grocery for restaurants, is also on steroids — up 97% YoY. Meanwhile, “Going Out” services (restaurant booking + events) grew 170% YoY, thanks to Paytm Insider’s integration and India’s unending appetite for concerts, cricket, and comedy shows.
On the downside, debt has crept from ₹70 crore in FY22 to ₹2,045 crore by FY25, and there’s a ₹402 crore GST demand letter from the taxman. But why worry when the stock is up 47% in six months?
3. Business Model (WTF Do They Even Do?)
Zomato’s empire runs on four revenue streams:
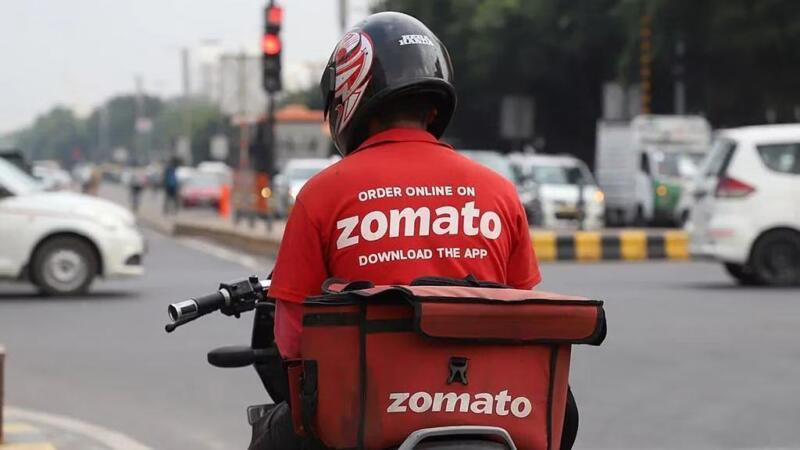
- Food Delivery– App-based restaurant discovery, ordering, and last-mile delivery via 4 lakh+ riders. Revenue +35% YoY in H1 FY25.
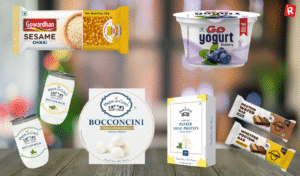
- Hyperpure Supplies– B2B supply chain for restaurants, sourcing directly from producers. Revenue +97% YoY.
- Quick Commerce (Blinkit)– 15-minute delivery of groceries, electronics, and random impulse purchases you regret
- later. Revenue +136% YoY.
- Going Out & Events– Table reservations, concert tickets, and festivals. Revenue +170% YoY post Paytm Insider acquisition.
Each is growing double digits, but profitability is still wafer-thin at2.48% OPMTTM. This is a volume game — margins might fatten eventually, but for now they look like they’re on intermittent fasting.
4. Financials Overview
| Metric | Jun-25 | Jun-24 | Mar-25 | YoY % | QoQ % |
|---|---|---|---|---|---|
| Revenue (₹ Cr) | 7,167 | 4,206 | 5,833 | 70.4% | 22.9% |
| EBITDA (₹ Cr) | 115 | 177 | 72 | -35.0% | 59.7% |
| PAT (₹ Cr) | 25 | 253 | 39 | -90.1% | -35.9% |
| EPS (₹) | 0.10* | 1.05* | 0.16* | -90.5% | -37.5% |
*Annualised EPS = Latest quarterly EPS × 4 → 0.10 × 4 = ₹0.40; Adjusted P/E = ₹318 / ₹0.40 ≈ 795×.
Commentary:Sales growth is phenomenal, but PAT fell off a cliff YoY because operating leverage works both ways — in bull runs and in accounting nightmares.
5. Valuation (Fair Value RANGE only)
Method 1 – P/E
- Annualised EPS: ₹0.40
- Industry PE: 28.2×
- FV Range: ₹11 – ₹15
Method 2 – EV/EBITDA
- Annualised EBITDA: ₹460 crore
- Industry EV/EBITDA: ~25×
- EV ≈ ₹11,500 crore → Per share: ₹120 – ₹130
Method 3 – DCF (Simplified)
- Assume 25% CAGR in free cash flow for 5 years, 12% discount rate → FV

