At a Glance
Ester Industries Ltd just served investors a cocktail of contradictions: sales climbed to ₹338 Cr, yet it posted a net loss of ₹7.2 Cr in Q1 FY26. The stock still trades at a wild P/E of 53, as if profits are hiding under the carpet. Operating margins are a weak 6%, contingent liabilities are a whopping ₹525 Cr, and return ratios (ROE 1.8%) barely move the needle. With polyester films, specialty polymers, and rPET in the mix, Ester has a great product story but financials that could use a miracle—preferably one that lasts longer than a single quarter.
Introduction
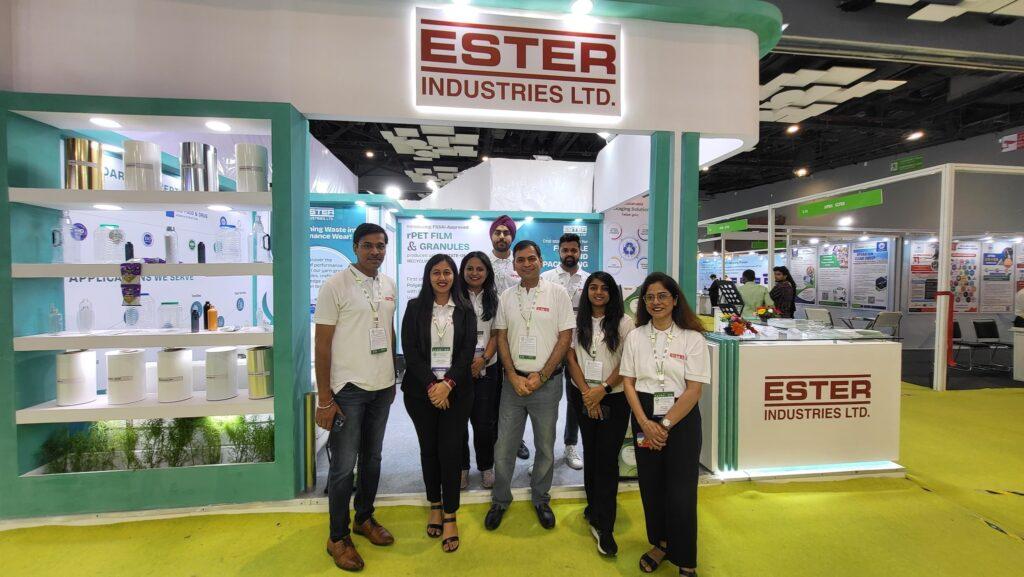
Once upon a time, Ester Industries was the cool kid in the polyester film and engineering plastics space. Today, it’s more like the kid who shows up to class but forgets homework. Founded in 1985, the company produces PET films, specialty polymers, and recycled PET (rPET) products. Its ISO certifications look good on paper, but investors are interested in profits, not paperwork.
FY25 was a rollercoaster: sales rose, but profits evaporated. The Q1 FY26 numbers didn’t help—losses continue while other packaging peers like EPL and TCPL Packaging are printing cash. With contingent liabilities looming like an uninvited guest and high debt servicing costs, Ester is trying to balance expansion with survival.
Business Model (WTF Do They Even Do?)
Ester makes polyester films (used in packaging, electronics, and industrial applications), specialty polymers (for engineering plastics), and recycled PET (eco-friendly but capital-heavy). Demand comes from FMCG packaging, industrial films, and export markets.
The company is part of a cyclical industry tied to crude oil prices, raw material volatility, and global demand. Margins swing like a pendulum—sometimes high (when resin prices cooperate), other times negative (when raw material costs spike). Ester’s current strategy focuses on specialty products and rPET to differentiate from commodity players.
Financials Overview
| ₹ Cr | FY23 | FY24 | FY25 | Q1 FY26 |
|---|---|---|---|---|
| Revenue | 1,114 | 1,063 | 1,282 | 338 |
| EBITDA | 93 | -23 | 147 | 20.3 |
| PAT | 137 | -121 | 14 | -7.2 |
| OPM % | 8% | -2% | 11% | 6% |
| ROE % | 4% | -5% | 2% | 1.8% (TTM) |
Commentary: Revenues are steady, but profits swing like a yo-yo. Q1 FY26 loss negates the fragile recovery seen in FY25.
Valuation
- P/E Method:
EPS TTM ≈ ₹2.4 → At P/E 15 (industry avg) → Fair Value ≈ ₹36.
Current P/E 53 → Overpriced by a mile. - EV/EBITDA:
EBITDA TTM ₹156 Cr, EV ≈ ₹1,400 Cr → EV/EBITDA ≈ 9 (slightly expensive). - DCF (simplified):
Assume FCF ₹50 Cr, growth 5%, WACC 10% → Fair value ≈ ₹40–₹50.
Fair Value Range: ₹35–₹50 versus CMP ₹124. Ouch.
What’s Cooking – News, Triggers, Drama
- Q1 FY26: Loss of ₹7.2 Cr, margins at 6%.
- Capex: Limited, focus on efficiency rather than expansion.
- rPET Story: Green product push, but slow monetization.
- Risks: High contingent liabilities, weak interest coverage, volatile raw material costs.
- Trigger: If specialty polymer margins improve, turnaround is possible.
Balance Sheet
| Assets | FY25 |
|---|---|
| Total Assets | ₹1,573 Cr |
| Net Worth | ₹773 Cr |
| Borrowings | ₹660 Cr |
| Liabilities | ₹140 Cr |
Remarks: Borrowings remain high, and net worth barely grows. Leverage is a concern.
Cash Flow – Sab Number Game Hai
| ₹ Cr | FY23 | FY24 | FY25 |
|---|---|---|---|
| Operating CF | 58 | 44 | 112 |
| Investing CF | -199 | 42 | -56 |
| Financing CF | 114 | -14 | -133 |
Remarks: Cash flows improved in FY25, but capital expenditure and debt repayments keep draining reserves.
Ratios – Sexy or Stressy?
| Ratio | FY25 |
|---|---|
| ROE | 1.8% |
| ROCE | 6.5% |
| P/E | 53.2 |
| PAT Margin | 1.7% |
| D/E | 0.9 |
Remarks: Ratios scream stress. Valuation is sky-high with no earnings to justify it.
P&L Breakdown – Show Me the Money
| ₹ Cr | FY23 | FY24 | FY25 |
|---|---|---|---|
| Revenue | 1,114 | 1,063 | 1,282 |
| EBITDA | 93 | -23 | 147 |
| PAT | 137 | -121 | 14 |
Remarks: Profit collapse in FY24, mild recovery in FY25, but Q1 FY26 loss raises doubts.
Peer Comparison
| Company | Rev (₹ Cr) | PAT (₹ Cr) | P/E |
|---|---|---|---|
| EPL Ltd | 4,213 | 362 | 20 |
| TCPL Packaging | 1,696 | 141 | 24 |
| Uflex | 15,036 | 241 | 18 |
| Ester Industries | 1,334 | 23 | 53 |
Remarks: Ester is the weakest link—lowest profits, highest P/E.
Miscellaneous – Shareholding, Promoters
- Promoter Holding: 62.73% (stable)
- FIIs: 0.17% (no love)
- DIIs: 0.01%
- Public: 37.09%
Promoters stay put, FIIs avoid, retail hopes.
EduInvesting Verdict™
Ester Industries is like a Bollywood comeback movie that never makes it past the trailer. Q1 FY26 loss, high P/E, contingent liabilities, and weak returns make it a risky bet. While the rPET and specialty polymers story has potential, execution is slow. Investors betting at current prices are either visionaries—or masochists.
SWOT Analysis
- Strengths: Established player, diversified product mix, green product pipeline.
- Weaknesses: High debt, low ROE, volatile margins.
- Opportunities: Growth in sustainable packaging and rPET demand.
- Threats: Raw material volatility, high liabilities, aggressive competition.
Final call? Ester is not yet the blockbuster investors dream of—it’s still stuck in production hell.
Written by EduInvesting Team | 30 July 2025
SEO Tags: Ester Industries, Polyester Film, rPET, Stock Analysis


