Ladies and gentlemen, welcome to the welding king of India. Esab India Ltd is sitting on a jaw-dropping 70% ROCE like it owns the factory floor. Q3 FY26 delivered ₹379 Cr revenue and ₹43 Cr PAT, with profit growing nearly 30% YoY.
But here’s the masala: it trades at 43 times earnings and 20 times book value. That’s luxury-brand pricing for a company that literally sells welding rods and cutting machines.
Debt? Almost zero. Dividend payout? 79–82% range recently. Cash generation? Strong.
So the big question: Are we looking at a premium industrial compounder… or a perfectly polished, slightly overvalued spark plug?
Let’s put on safety gloves and inspect.
2. Introduction – From Welding Shop to Wall Street Darling
Founded via acquisitions starting in 1987, Esab India didn’t just build a business — it assembled it like a precision weld. It acquired welding businesses of Peico Electronics (Philips India), Indian Oxygen, Flotech Welding, and merged Maharashtra Weldaids.
Translation? It consolidated India’s welding landscape before “roll-up strategy” became fashionable on LinkedIn.
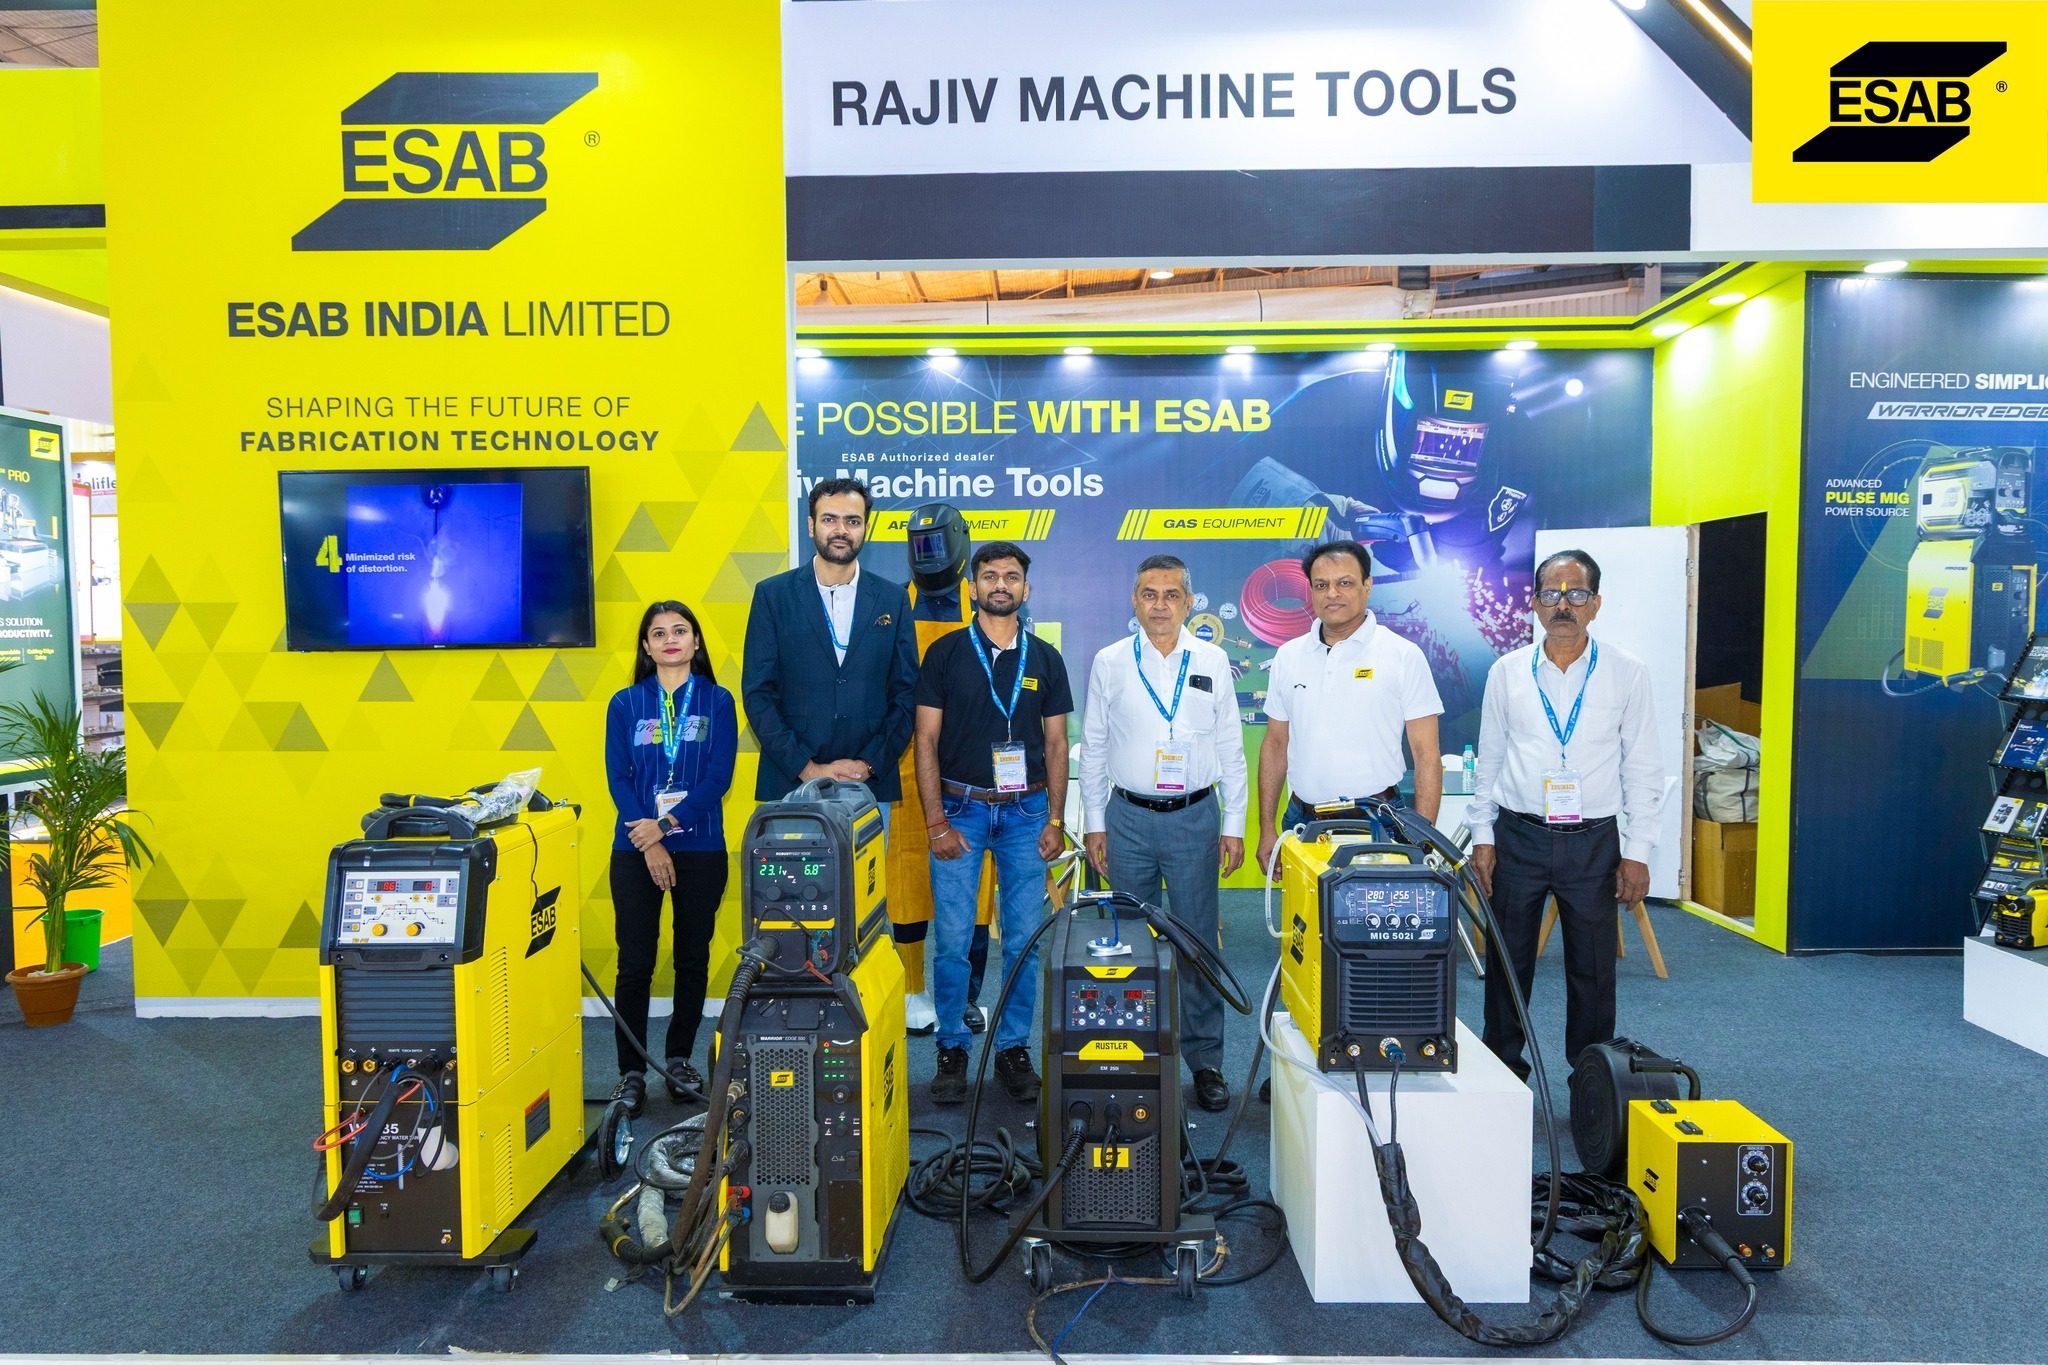
It operates 4 manufacturing facilities — Chennai, Kolkata, Nagpur and Chengalpet — and distributes via ~200 distributors. Around 80% sales come from distributors. The remaining 20% are direct institutional clients.
Its product bouquet? Everything from welding consumables to plasma cutting systems to robotics and PPE.
And behind it stands the global ESAB group — present in 80 countries, 8,700 employees, 26 manufacturing facilities. Ultimate parent: ESAB Corporation USA.
So yes — this is not your local welding shop. This is industrial royalty.
But royalty comes with royalty valuation.
Are we paying for quality? Or are we paying for brand glow?
3. Business Model – WTF Do They Even Do?
Let me explain this like you’re a smart but lazy investor.
Whenever two pieces of metal need to become one — bridges, cars, pipelines, factories — someone has to weld them.
Esab sells:
Welding consumables (electrodes, wires)
Arc welding equipment
Plasma cutting systems
Gas equipment
Automation & robotics
PPE & digital solutions
FY23 revenue mix:
Manufactured goods – 73%
Traded goods – 21%
Services – 6%
This is beautiful.
Why?
Because consumables create recurring demand. Every time metal melts, rods get used. Every project consumes more material.
The distribution moat is powerful. 200 distributors. 80% channel-driven sales.
Plus exports to over 20 countries including Australia, USA, Germany, Brazil, Vietnam.
Here’s the kicker: They also provide R&D and shared services to group companies globally. So India isn’t just a market — it’s a strategic hub.
But remember — they pay trademark fees to parent (₹20 Cr in FY22). And related party transactions exist.
So while profits shine, money also flows upstream.
Question: How much pricing power truly belongs to India, and how much to global HQ?