1.At a Glance
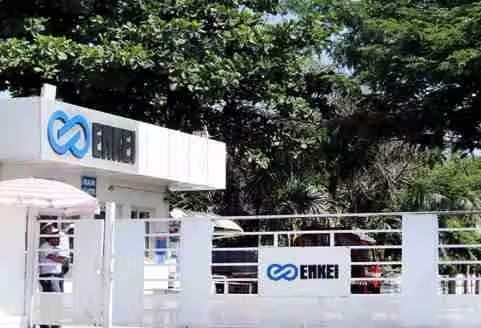
If alloy wheels had a gossip column,Enkei Wheels India Ltd (EWIL)would be the star this quarter. The ₹859 crore market cap subsidiary of Japan’s Enkei Corporation just delivered aQ2FY26 (Sept 2025)performance that made analysts rub their eyes twice. Revenue hit₹265 crore, marking an11.1% YoY growth, whilenet profit skyrocketed 274%to ₹7.94 crore.
That’s right — a company that’s been quietly struggling with thin margins suddenly pulled off a dramatic turnaround, despite a lowlyROCE of 3.94%andROE of barely 1.06%. The current market price stands at ₹478 (as of Nov 4, 2025), which is down31% YoY, making this one of those “you hate to love it” stocks.
Debt? A bit chunky at ₹250 crore (Debt/Equity = 1.1). Dividend? None. Management churn? Oh, plenty — new MD, new CFO, same story: Japanese discipline meets Indian paperwork. The Pune plant is revving with an expandedMAP 2 line, adding20,000 wheels/monthcapacity from March 2025.
Will the new leadership steer Enkei out of the slow lane, or is this just a wheelie of hope? Let’s roll.
2.Introduction
In India, we don’t buy cars — we buy “status symbols with four wheels.” And who makes those wheels shine? Companies like Enkei Wheels India Ltd.
Born in 2009 as the Indian arm of Japan’s Enkei Group, the company has been supplyingaluminium alloy wheelsto some of the country’s biggest OEMs —Honda, Toyota, Maruti Suzuki, Suzuki Motorcycles— basically, half the vehicles that zip past you on a Monday morning.
But behind those shiny alloys lies a tale of struggle. Margins thinner than papad, profits more volatile than your crypto portfolio, and return ratios that could make even auditors yawn.
Still, this quarter, something clicked. The Pune plant’s capacity expansion started bearing fruit, demand from both two-wheeler and four-wheeler segments stabilized, and the numbers started to move up. After years of low single-digit returns and “we’ll do better next quarter” conference calls, Enkei finally posted a quarter that deserves a slow clap.
But is this the start of a sustainable uptrend or just a short pit stop before the engine sputters again? Let’s pop open the bonnet.
3.Business Model – WTF Do They Even Do?
In plain English: Enkei Wheels India makesaluminium alloy wheels— those fancy rims that make your Honda City look like it’s auditioning forFast & Furious: Pune Drift.
Their business is split into two main segments:
- Four-Wheeler Wheels (~67% of FY24 revenue)– Supplies to Honda, Maruti Suzuki, Toyota.
- Two-Wheeler Wheels (~31% of FY24 revenue)– Supplies to Honda, Suzuki, and Kawasaki.
- Scrap & Other Sales (~2%)– Because in manufacturing, even the leftovers have a resale value.
The company runs a manufacturing facility inPune, capable of churning out 1.1 lakh four-wheeler wheels and 1.2 lakh two-wheeler wheels every month. In 2025, they juiced up production with theMAP 2 line upgrade and MAT facility, adding another20,000 wheels/monthto capacity.
Sounds smooth? Not quite. It’s alow-margin, high-capexbusiness, where any slowdown in auto sales or raw material price spikes (read: aluminium tantrums) can throw profits off the road.
But Enkei plays the long game — Japanese tech, strict quality control, and OEM stickiness. Once Honda loves your wheel, it’s not switching easily. Think of it as an arranged marriage between metallurgy and trust.
4.Financials Overview
| Metric | Latest Qtr (Sep 2025) | YoY Qtr (Sep 2024) | Prev Qtr (Jun 2025) | YoY % | QoQ % |
|---|---|---|---|---|---|
| Revenue | ₹265.11 Cr | ₹238.62 Cr | ₹233.16 Cr | 11.1% ↑ | 13.7% ↑ |
| EBITDA | ₹29.99 Cr | ₹22.47 Cr | ₹16.85 Cr | 33.4% ↑ | 78.0% ↑ |
| PAT | ₹7.94 Cr | ₹-4.56 Cr | ₹-1.71 Cr | 274% ↑ | Back to Profit |
| EPS (₹) | 4.42 | -2.54 | -0.95 | 274% ↑ | Turnaround |
Enkei went from negative EPS to ₹4.42 — a massive turnaround. Annualised EPS = ₹4.42 × 4 = ₹17.68.
At ₹478/share, that gives aP/E of ~27x— not bad for a company that just remembered what profit looks like.
Commentary:Enkei’s quarter felt like that friend who finally started hitting the gym — results still modest, but directionally impressive. Operating margins rebounded to
11.3%, the highest in two years, and profits returned after three dull quarters.
5.Valuation Discussion – Fair Value Range
Let’s crunch the alloys:
(a) P/E MethodAnnualised EPS = ₹17.68Industry P/E = 32.7 (Auto Components average)Apply conservative 20x–25x range:Fair Value Range = ₹354–₹442
(b) EV/EBITDA MethodEV = ₹1,101 CrEBITDA (TTM) = ₹66 CrEV/EBITDA = 16.7× (High)Peer median = ~12×Fair Value (based on 12×) = ₹66 × 12 = ₹792 Cr EV → Equity Value ≈ ₹550–₹600 Cr → Per Share ≈ ₹305–₹330
(c) DCF (Simplified)Assume: 10% long-term growth, 10% WACCBase FCF (negative currently, assume recovery to ₹10 Cr in FY27)DCF fair range = ₹320–₹380
✅Educational Fair Value Range:₹320 – ₹440
This fair value range is for educational purposes only and not investment advice.
6.What’s Cooking – News, Triggers, Drama
The last few months at Enkei Wheels could make a corporate soap opera blush.
- CFO Reshuffle:Mr. Jitendra Parmar resigned in mid-2024, followed by the appointment ofMr. Kunal Dhokein October 2024. Because what’s a financial year without at least one CFO change?
- Managing Director Swap:The Japanese big bossMr. Kazuo Suzukistepped down in February 2025, handing over toMr. Kenjiro Hama. Hopefully, Mr. Hama brings fresh torque to the boardroom.
- Capacity Expansion:The Pune MAP 2 line started mass production in March 2025, adding 20,000 wheels/month. The MAT facility is now humming at full tilt.
- Tax Drama:In August 2024, the company received ashow-cause cum demand notice— because, of course, the taxman never misses a spin.
- Result Season Hype:Q2FY26 results released today (Nov 5, 2025) — and they delivered the long-awaited turnaround quarter.
In short: New management, new plant line, old patience — maybe, just maybe, the turnaround is real this time.
7.Balance Sheet – Alloyed and Loaded
| Particulars (₹ Cr) | Dec 2023 | Dec 2024 | Jun 2025 |
|---|---|---|---|
| Total Assets | 534 | 564 | 634 |
| Net Worth (Equity + Reserves) | 233 | 235 | 228 |
| Borrowings | 167 | 206 | 250 |
| Other Liabilities | 134 | 122 | 157 |
| Total Liabilities | 534 | 564 | 634 |
Highlights (with a twist):
- 🧾 Borrowings are rising
