1. At a Glance – Jal Hai Toh Kal Hai… Par Cash Kahan Hai?
At ₹307 per share and a market cap of ₹1,707 crore, EMS Ltd is trading at a P/E of 13 — comfortably below the industry P/E of 21.8. Sounds cheap? Wait. The stock is down 32.3% in 3 months and a painful 52.6% in one year.
Latest Q3 FY26 (December 2025 quarter) numbers show revenue at ₹200 crore, down 18.3% YoY, and PAT at ₹18.8 crore, down a dramatic 62.7% YoY. OPM has fallen to 15%.
ROCE is still healthy at 26.9%, ROE at 20.7%, debt-to-equity just 0.16, and order book above ₹1,800 crore. On paper, this is an infrastructure company with government-backed projects and strong historical growth — 39% 3-year sales CAGR and 33% 3-year profit CAGR.
But here’s the twist: Between FY22–FY24, the company made ₹340 crore in profit but reported negative operating cash flow during that period. Debtor days have stretched to 142. Promoters have pledged 26.4% of their holding.
So what’s this? A solid EPC compounding story temporarily in slowdown mode? Or a working capital machine that eats cash faster than it builds sewage plants?
Let’s investigate.
2. Introduction – The Sewage King of North India
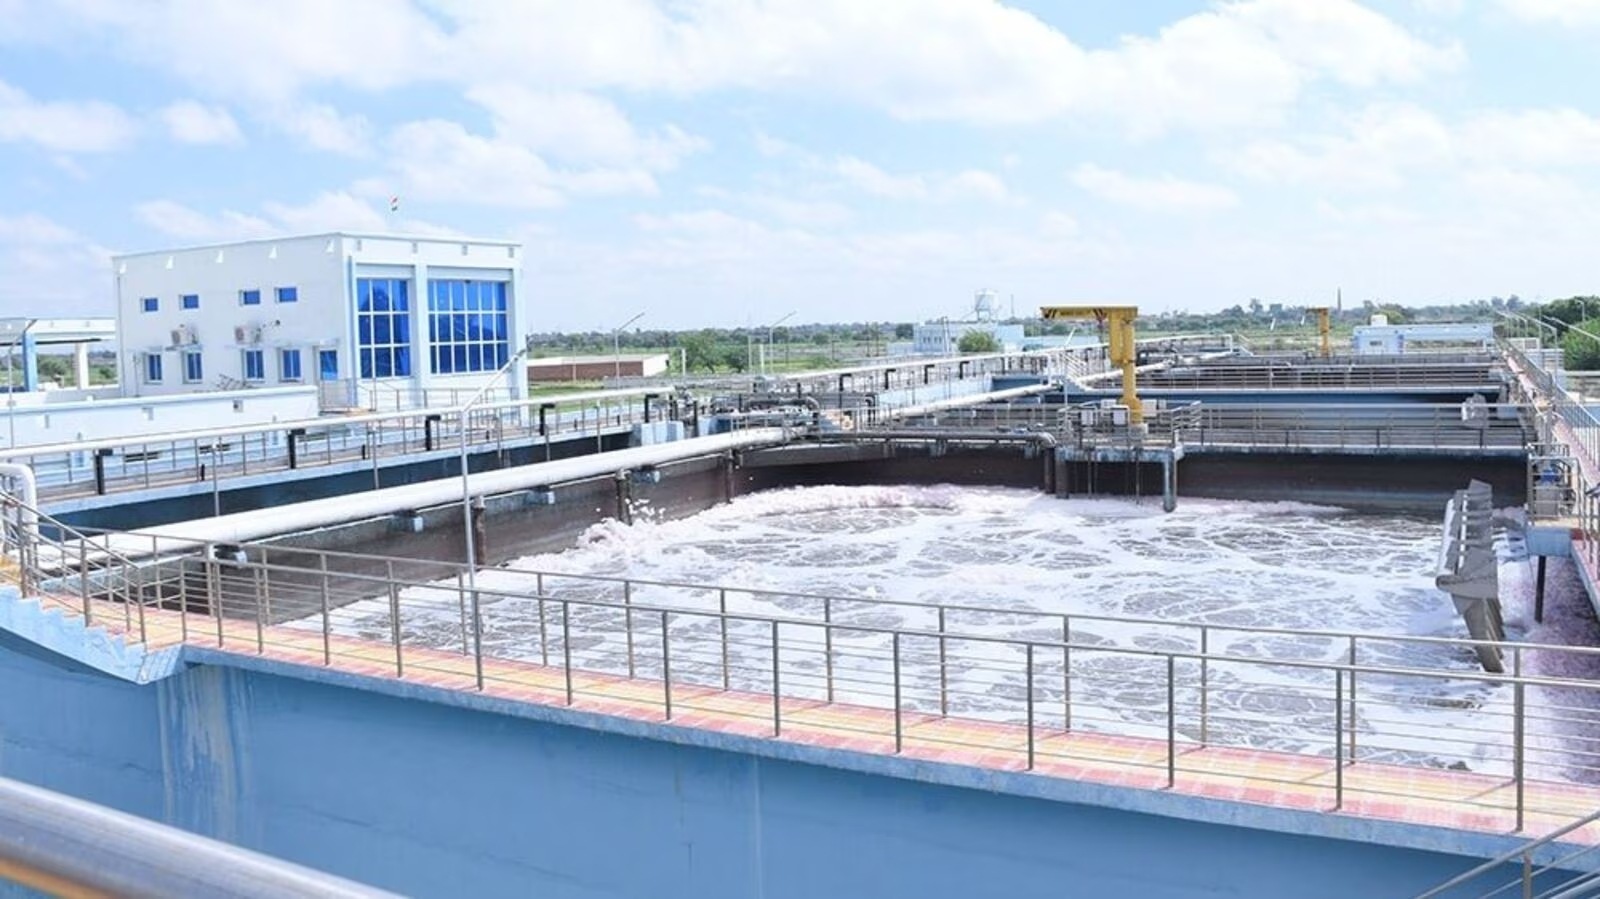
EMS Ltd is one of those companies that quietly builds what nobody wants to talk about — sewage treatment plants, pipelines, pumping stations.
They don’t sell smartphones. They don’t build luxury towers. They clean your city’s waste water.
And that is serious business.
Founded as a multi-disciplinary EPC player, EMS focuses primarily on Water & Sewerage Projects (70% of FY25 business) and Civil Engineering/Electrical EPC (30%).
They work with government bodies under schemes like AMRUT and NMCG. Translation? Their client is usually the government. Which means:
- Payments can be slow.
- Projects are large.
- Margins look great on paper.
- Working capital can become a horror story.
The company has completed 70+ projects across Uttar Pradesh, Rajasthan, Bihar, Uttarakhand, MP and Maharashtra. They’ve treated over 500 billion liters of sewage and laid more than 1,400 km of sewer pipeline.
But here’s the real question:
If they’ve treated half a trillion liters of sewage… why is the stock chart looking like untreated drainage?
3. Business Model – WTF Do They Even Do?
Imagine this:
A city needs a sewage treatment plant (STP). The government floats a tender. EMS bids, wins it, builds the plant, lays pipelines, installs pumping stations, sometimes operates it for years.
That’s their bread and butter.
Segment 1: Water & Sewerage (70%)
- Sewage Treatment Plants (STPs)
- Water Treatment Plants (WTPs)
- Sewer Network Schemes
- Common Effluent