Search for Stocks /

Elgi Rubber Company FY26: A ₹240 Crore Loss, EPS of −₹48, and a Dutch Subsidiary That Filed for Its Own Funeral

Spotted a factual error — a wrong number, date, or fact? Tell us and we will check the source.

General information and entertainment, not investment advice. The author is not a SEBI-registered adviser or research analyst. No recommendation, no promised returns. Markets carry risk including loss of capital. Figures may not be current. Consult a registered adviser before acting.

1 — At a Glance

Elgi Rubber Company closed FY26 with revenue of ₹366 Cr — almost exactly where it stood five years ago — and a net loss of ₹240 Cr. To frame the size of that hole: the loss is roughly two-thirds of the year’s entire turnover. Reported EPS landed at −₹48.00. The company’s own net worth, ₹180 Cr at the end of FY25, shrank to ₹76 Cr a year later.

The headline number didn’t come from the rubber business breaking. It came from a step-down subsidiary in the Netherlands, Rubber Resources B.V., filing for liquidation in January 2026 — after which the group recognised large impairments tied to that exit. Infomerics, the rating agency, put the impairment at roughly ₹170 crore and downgraded the company’s ₹326.36 Cr facilities to IVR BB−/Negative.

Meanwhile the operating business kept turning: a six-unit manufacturing footprint, a tyre-retreading franchise network, customers including CEAT and MRF. The tension of this entry is the gap between an operating business that still ships product and a consolidated P&L that just absorbed a one-time catastrophe.

A reference reader’s note: a loss this large rarely arrives without a single dominant cause behind it. Here, the cause has a name and a country.

Does a ₹43.5 Cr land sale and a promise to curtail overseas exposure close a ₹240 Cr gap, or just begin the conversation? The rest of this entry lays out the record.

2 — Introduction

Elgi Rubber Company Limited, incorporated in 1981 and listed on the NSE, sits in an unglamorous corner of industrials: tyre retreading and rubber recycling. It makes reclaim rubber, tread rubber, bonding gum, and the machinery retreaders use to put new life into old tyres. The model is “one-stop shop for retreaders” — materials, machines, consumables, technical support.

The company runs six manufacturing units across Tamil Nadu and Kerala and, until recently, managed a sprawl of subsidiaries across the USA, Brazil, Kenya, Bangladesh, Sri Lanka, Australia and the Netherlands. That international sprawl is the thread running through FY26.

The recent record, all from filings: in January 2026 the board approved a voluntary liquidation filing for Rubber Resources B.V., the Dutch step-down subsidiary, which the company itself flagged as contributing about a quarter of consolidated revenue. By May 2026 the audited FY26 results carried the full impact. In May and June the company executed a sale of non-core Coimbatore land for ₹43.5 Cr, and the board re-appointed its Chairman and Managing Director and Executive Director for fresh five-year terms.

A year, in short, of unwinding what earlier years had built abroad.

3 — Business Model: WTF Do They Even Do?

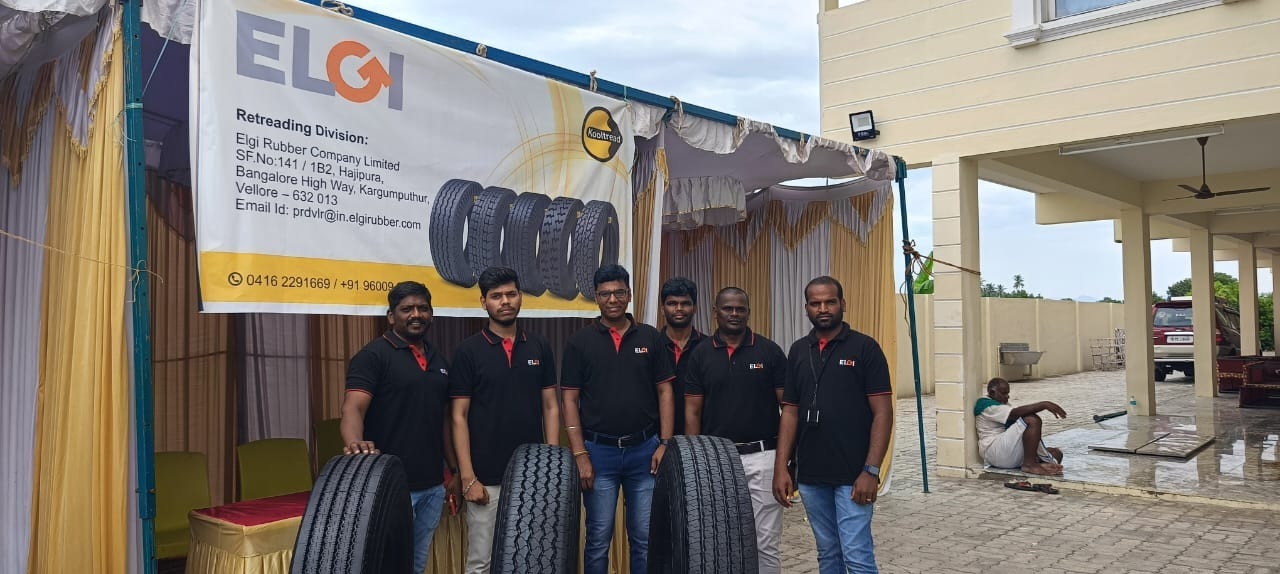
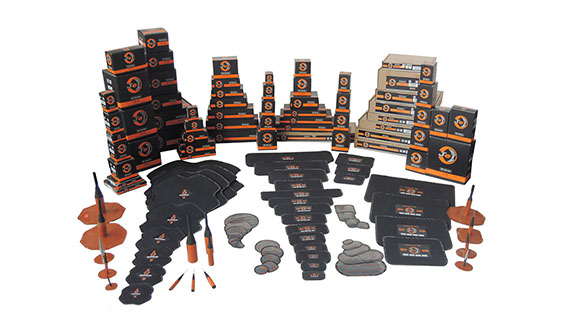
Strip the jargon and Elgi Rubber is in the business of refusing to let tyres die. A truck tyre wears its tread; retreading bonds a fresh layer on, and the carcass rolls again. Elgi sells nearly every input that process needs: pre-cured tread rubber, bonding gum, curing envelopes, repair patches (the SC, HC and CB series, because everything in this industry must have a series), blades, carbides, and the machines themselves.

The brand cupboard is unexpectedly full — Jet, CRS, Armonas, Pincott, Carbrasive, Midwest Rubber, Western Weld — for a company most investors have never heard of. The fourth leg is reclaim rubber: butyl, chloro-butyl and whole-tyre reclaim, the recycling-the-recycling end of the trade.

ELGI Rubber in India | Tyre retreading machinery

The customer list is the genuinely impressive part. CEAT and MRF buy here. When the tyre majors you’ve heard of are your clients, the business clearly works at the product level.

So the model isn’t broken. A company can make a perfectly sensible thing, sell it to perfectly real customers, and still post a ₹240 Cr loss — because the damage came from somewhere the product catalogue can’t reach. That’s the whole story of FY26 in one sentence, and we’ll spend the rest of this entry watching it play out across the statements.

4 — Financials Overview

Figures are consolidated, in ₹ crore. This is a full-year (FY26) record.

MetricFY26FY25YoY
Revenue366384−4.5%
Operating Profit−626swung negative
PAT−240−4loss deepened ~55x
EPS (₹)−48.00−0.87

Revenue slipped modestly. Operating profit, positive at ₹6 Cr the prior year, swung to a ₹62 Cr operating loss — an OPM of −17%. Then the exceptional items landed below the operating line and the bottom line went from a ₹4 Cr loss to a ₹240 Cr one.

Per the company’s filing, FY26 carried the full impairment of its investment and loans tied to Rubber Resources B.V., the Dutch step-down subsidiary that entered liquidation on 26 January 2026, recognised as a non-recurring exceptional item. The statutory auditors, Arun & Co, expressed an unmodified opinion on the results.
The record here describes a year with two distinct events stacked on top of each other: a weak operating year, and a one-time write-down many times its size.

5 — Market Expectations & Historical Multiples

This section describes how the market is currently pricing the company and how that compares with its own history and peer group. It is descriptive, not predictive.

MetricCurrentHistorical AveragePeer Median
P/Enot meaningful (negative earnings)24.73
EV/EBITDA−14.0
P/B2.95
ROE−67.5%−13.3% (5-yr)
ROCE−12.9%19.61

With FY26 earnings negative, a price-to-earnings multiple has no denominator worth quoting — the market is pricing a company that did not earn. The peer median trades at about 24.7x earnings; Elgi’s earnings line removes it from that comparison entirely. What remains is a ₹224 Cr market cap carried at 2.95 times a book value that itself fell sharply during the year, and an EV/EBITDA that is negative because consolidated EBITDA turned negative.

What the market appears to be pricing here is not the FY26 P&L but what comes after it: the asset-monetisation plan, the stated intent to exit loss-making overseas units, and whether the operating business returns to the positive operating profit it posted as recently as FY24. The ₹224 Cr capitalisation sits against ₹76 Cr of net worth and ₹313 Cr of borrowings.

One factual observation on market expectations: the company is being valued on a book and a recovery, not on current earnings, because current earnings are a loss larger than annual revenue would suggest is recoverable in one year.

6 — What’s Cooking

Real events, all from filings, and FY26 had a full plate:

The defining one — Rubber Resources B.V., the Netherlands step-down subsidiary, voluntarily filed for liquidation on 26 January 2026 and was deconsolidated from that date. The company flagged it as having contributed roughly a quarter of consolidated revenue.

Infomerics downgraded the ₹326.36 Cr bank facilities to IVR BB−/Negative on 8 June 2026, citing the FY26 deterioration.

Asset monetisation began: the company executed a sale deed on 25 June 2026 for 75 cents of Coimbatore land and buildings to an unrelated buyer, Mr. S. Senthilnathan, for ₹43.5 Cr, with a ₹10.06 Cr advance received in May.

The board also approved a reversal of ₹16.43 million in interest receivable from its US and Brazil subsidiaries, and re-appointed Sudarsan Varadaraj as CMD (effective January 2027) and Harsha Varadaraj as Executive Director.

A busy year — though most of the activity was the sound of a company tidying up after a fire, not lighting new ones.

7 — Balance Sheet

ItemFY24FY25FY26
Total Assets566520434
Net Worth19017976
Borrowings307270313
Other Liabilities697146
Total Liabilities566520434

Assets equal liabilities in each column. Three observations aimed at the numbers:

  • Net worth fell from ₹179 Cr to ₹76 Cr in a single year — a ₹103 Cr evaporation that matches the reserves line collapsing from ₹174 Cr to ₹71 Cr.
  • Borrowings rose to ₹313 Cr in the same year the equity cushion under them shrank by more than half — debt going up while the thing absorbing its risk goes down.
  • Total assets contracted ₹86 Cr, consistent with a balance sheet that lost a subsidiary and wrote down what it was owed.

The reserves did the bleeding so the share capital didn’t have to. A balance sheet can shrink two ways — by repaying what it owes or by losing what it owns — and this one chose the second.

8 — Cash Flow: Sab Number Game Hai

YearOperatingInvestingFinancing
FY246−1610
FY25−877−62
FY26−11−611

Trace the money and a pattern shows: operating cash flow has gone from a thin positive to two consecutive negatives, −₹8 Cr then −₹11 Cr. FY25’s ₹77 Cr investing inflow was the year an asset sale temporarily filled the tank, and financing promptly drained ₹62 Cr of it paying down debt. In FY26, financing turned positive again as borrowings climbed.

When the operations stop generating cash and the asset sales become the funding plan, the cash flow statement quietly tells you which engine is actually running.

9 — Ratios: Sexy or Stressy?

RatioValue
ROE−67.5%
ROCE−12.9%
P/Enot meaningful
PAT Margin−66%
D/E4.13

ROE of −67.5% means the equity didn’t work part-time — it actively destroyed itself this year. ROCE at −12.9% says the capital employed returned less than nothing on an operating basis. PAT margin of −66% reflects a loss two-thirds the size of sales, the impairment doing most of that. Debt-to-equity at 4.13x describes a structure where lenders have put in roughly four times what owners now have left. Each ratio here is reading the same FY26 event from a different angle.

10 — P&L Breakdown: Show Me the Money

YearRevenueOperating ProfitOther IncomePATEPS (₹)
FY243862533122.33
FY25384633−4−0.87
FY26366−62−130−240−48.00

The Other Income column is the tell. In FY24 and FY25 it ran a healthy ₹33 Cr — a meaningful chunk of profit was non-operating. In FY26 it flipped to negative ₹130 Cr, which is where much of the subsidiary write-down and related charges flowed through. Anchor on operating profit and PAT: operating profit went from ₹25 Cr (FY24) to a ₹62 Cr loss, and PAT from ₹12 Cr to a ₹240 Cr loss.

EPS moved in step with PAT — share count was steady at 5.005 crore shares throughout, so the −₹48.00 EPS is a genuine reflection of the loss, not a dilution artefact. The trajectory is a business that earned modestly two years ago, broke even-ish at the operating line last year, and then took the full force of an overseas exit this year.

11 — Peer Comparison

CompanyRevenue (Qtr)PAT (Qtr)P/E
Apcotex Industries3983526.3
Pix Transmission1712023.4
Tinna Rubber1571732.6
GRP145−1267.4
Rubfila Intl.161614.7
Elgi Rubber86−204

The peer set, as a fact, earns money: most carry P/E multiples in the 14–33x band on positive quarterly profits and ROCE figures around 12–22%. Elgi sits apart — a quarterly net loss of ₹204 Cr against peers posting positive double-digit-crore profits, and no P/E because there are no earnings to divide into. Its ROCE of −12.9% is the only negative figure in a peer table where the median is 19.6%. The gap here is not multiple-versus-margin; it’s profit versus loss.

12 — Miscellaneous: Shareholding & Promoters

Holder%
Promoters65.03
Institutions (FII + DII + Govt)3.30
Public31.67

Promoter holding has sat unchanged at 65.03% across every quarter shown. The promoter group is led by Sudarsan Varadaraj, holding 47.09% individually, with the Varadaraj family and group entities filling out the rest. Institutional interest is minimal — FIIs near zero, DIIs under 1%.

The note that belongs in the record: 21.5% of promoter holding is pledged. A two-thirds promoter stake reads as conviction; a pledged slice of it reads as a reminder that conviction can be collateral too.

13 — Corporate Governance: Angels or Devils?

The audit record is clean on its face — Arun & Co issued an unmodified opinion on the FY26 standalone and consolidated results. But the auditors did draw attention to two matters: three foreign subsidiaries with negative net worth dependent on continued support from the parent, indicating a material uncertainty over their ability to continue as going concerns; and the loss of control over Rubber Resources B.V. on liquidation.

The board re-appointed Chairman and Managing Director Sudarsan Varadaraj for a further five years from January 2027 (he turns 70 that month), and Executive Director Harsha Varadaraj, his son, for five years from November 2026. The board he chairs approved both. Related-party activity surfaced in the ₹16.43 million interest reversal on loans to the US and Brazil subsidiaries.

No tax demand or auditor resignation appears in this year’s record. The flags here are real and disclosed: pledged promoter shares, going-concern notes on overseas units, and a family-led board re-appointing itself.

14 — Industry Roast & Macro Context

The rubber-products and retreading trade is a margin-thin, input-exposed business, and the filings spell out the structural squeeze: profitability is vulnerable to raw-material price volatility tied to crude-oil trends and global supply-demand. Pricing power is limited — short-duration contracts and escalation clauses let some cost get passed on, but sustained input spikes still compress margins.

It’s a sector where you can do everything right at the factory and still watch a commodity curve eat your operating line. The retreading end depends on freight activity and on truckers choosing a retread over a new tyre — a decision that follows the macro cycle more than any sales pitch. And for a company that built a multi-country subsidiary network, the sector’s other lesson arrived this year: international expansion in a thin-margin trade adds revenue lines and currency exposure in equal measure, and the second can outlive the first.

15 — EduInvesting Verdict

StrengthsWeaknesses
Established product range, real clients (CEAT, MRF)₹240 Cr FY26 loss; net worth down to ₹76 Cr
Promoter holding steady at 65%D/E of 4.13x; borrowings rose to ₹313 Cr
Operating profit positive as recently as FY24Going-concern uncertainty on three foreign subsidiaries
OpportunitiesThreats
Asset monetisation underway (₹43.5 Cr land sold)Negative outlook on IVR BB− rated facilities
Stated intent to exit loss-making overseas unitsOperating cash flow negative two years running

FY26 is the year a working rubber business and a failed overseas bet appeared on the same income statement, and the bet won the headline. The operating engine still runs; the consolidated entity spent the year absorbing what that engine never built.

A factory that still makes things, a balance sheet that just lost a continent’s worth of them.