1. At a Glance
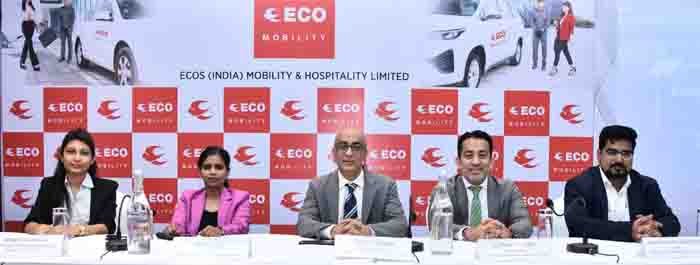
Ecos (India) Mobility & Hospitality Ltd has cracked the art of running a transportation empire without the burden of parking lots. Operating a 90% vendor-owned fleet of over 12,500 vehicles, they’ve chauffeured corporate India (and a few MNC execs pretending to be VIPs) across 109 cities and 30+ countries. In FY24 alone, they clocked 3.1 million trips. Their model? Be the middleman between corporates who want clean, air-conditioned rides and vendors who want business — and keep the margins flowing.
2. Introduction
If Ola and Uber are the Tinder of ride-hailing, Ecos is the LinkedIn. You won’t find late-night surge pricing drama here; instead, think suited chauffeurs, pick-up lists printed on A4, and the calm predictability of corporate invoices.Born in 1996, Ecos grew from a simple chauffeur service into a multi-city corporate transport network with a client list featuring 1,100+ organisations. They’re not chasing app downloads — they’re chasing recurring B2B contracts that keep the wheels turning year-round.In a country where most fleet operators bleed money buying depreciating cars, Ecos flipped the script: outsource the cars, own the customer relationship, and keep the books light.
3. Business Model (WTF Do They Even Do?)
Ecos’ business is built on anasset-lightmodel. Over 90% of the fleet is owned by vendors, meaning Ecos avoids capital-heavy purchases. They focus on:
- Chauffeured Car Rentals– Corporate airport drops, day-long assignments, or multi-day outstation trips.
- Employee Transportation– Those early morning and midnight shifts that keep IT/BPO workers moving.
- Hospitality Logistics– Tying up with hotels & events to move guests seamlessly.Revenue comes from contracts with corporates and institutions, while Ecos handles scheduling, vendor payments, and client servicing. This is logistics meets relationship management — without
- the fuel bills.
4. Financials Overview
Let’s crunch the numbers:
- TTM Revenue: ₹660 Cr
- TTM Net Profit: ₹58 Cr
- YoY Sales Growth (FY25): ~17%
- OPM: 14%
- ROE: 29.4% (because debt is almost non-existent)
- EPS (FY25): ₹9.63
- P/E (at ₹298): 30.9 (TTM EPS)RecalculatedAnnualised P/Efrom Q1 FY26 EPS (₹2.21 × 4 = ₹8.84) →33.7.The profit CAGR over the last 5 years is an insane114%, but TTM profit dipped slightly (-4%) thanks to softer margins in Q1 FY26.
5. Valuation (Fair Value RANGE only)
| Method | Assumptions | Value per Share (₹) |
|---|---|---|
| P/E Multiple | Sector avg ~25×, EPS ₹8.84 | 221 – 265 |
| EV/EBITDA | EBITDA ₹91 Cr, Sector multiple ~12× | 250 – 280 |
| DCF | 12% discount rate, 10% growth for 5 yrs | 240 – 270 |
Fair Value Range:₹221 – ₹280This FV range is for educational purposes only and is not investment advice.
6. What’s Cooking – News, Triggers, Drama
- Q1 FY26 results: Sales up 23% YoY to ₹178 Cr, but margins dipped to 12% OPM.
- Final dividend for FY25 declared; record date 18


