Q3 FY26 numbers? Sales at ₹424.87 Cr. PAT at ₹5.77 Cr (vs ₹3.53 Cr YoY). Quarterly profit up 316% YoY.
Sounds heroic, right?
Now look at the valuation — 138 P/E. That’s “I build fighter jets” level optimism.
But the real question is this: Is this a precision-engineered aerospace story… or a valuation that already assumes we’re supplying parts to Mars?
Let’s open the hangar doors.
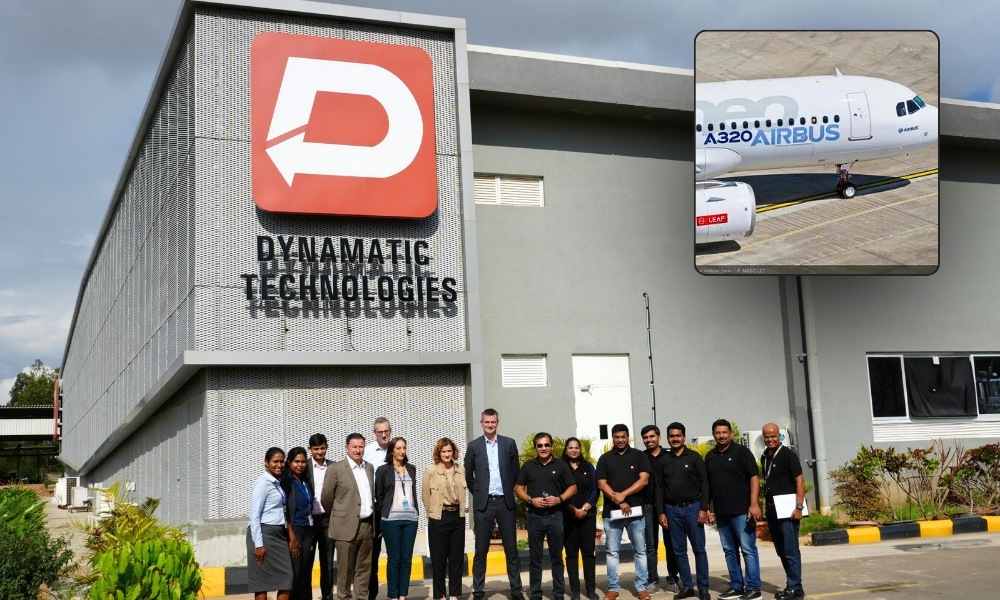
2. Introduction – From Tractor Pumps to Fighter Jets
Dynamatic Technologies Ltd started in 1973 making hydraulic gear pumps. Very mechanical. Very boring. Very profitable once upon a time.
Fast forward to FY24 — aerospace now contributes 36% of revenue. In FY15, it was just 16%.
That’s not evolution. That’s a career switch.
The company now operates 9 manufacturing facilities across India, UK, and Germany. It serves clients like Airbus, Boeing, Dassault, HAL, BMW, Audi, John Deere — basically the guest list of a global manufacturing party.
Geographically, revenue split:
Europe (ex-UK): 37%
India: 23%
UK: 19%
US: 11%
Canada + ROW: 10%
This isn’t a domestic-only midcap. This is a globally exposed industrial manufacturer.
But here’s the contradiction:
Global clients
Defence partnerships
Aerospace expansion
Massive contracts
Yet ROE is 6.21%.
Are we looking at a company in transformation mode? Or one still learning how to convert engineering brilliance into shareholder returns?
Let’s decode.
3. Business Model – WTF Do They Even Do?
Alright, imagine three businesses living under one roof:
1️ Hydraulics (31% of FY24 revenue)
They manufacture:
Hydraulic valves
Gear pumps
Fixed displacement pumps
Fan drive systems
They hold:
80% share in Indian OEM tractor market
38% share in global tractor market
That’s serious dominance. If tractors had Instagram, this company would be verified.
2️ Metallurgy (33%)
Casting and forging of:
Intake manifolds
Exhaust manifolds
Case fronts
Clients include Audi, BMW, Daimler, Volkswagen.
Translation: They supply components that sit inside engines and silently do their job.
Not glamorous. But critical.
3️ Aerospace (36%)
Now this is where the glamour is.
They manufacture:
Wings
Rear fuselages
Ailerons
Wing flaps
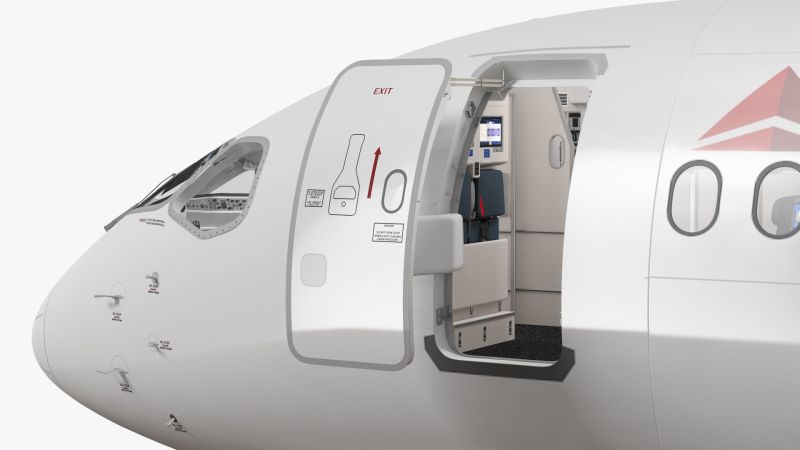
Airbus A220 doors
Falcon 6X aerostructures
They’ve:
Relocated aerospace facility near Bangalore International Airport (FY24)
Entered partnership with Deutsche Aircraft for D328eco rear fuselage
Signed long-term deals for Airbus A220
Onboarded as exclusive partner for AMCA 5th-gen fighter program (via L&T-BEL consortium)
This is serious defence positioning.
But here’s your question:
If aerospace is growing… Why is ROCE still under 9%?
Are margins yet to kick in? Or is capital intensity eating returns?
4. Financials Overview – Let’s Open the Spreadsheet