Search for Stocks /

Dynacons Systems & Solutions Ltd: FY26 in Flux

Spotted a factual error — a wrong number, date, or fact? Tell us and we will check the source.

General information and entertainment, not investment advice. The author is not a SEBI-registered adviser or research analyst. No recommendation, no promised returns. Markets carry risk including loss of capital. Figures may not be current. Consult a registered adviser before acting.


1. At a Glance

Dynacons posted ₹1,424 crore in revenue for FY26 (up 12% year-on-year) and ₹85 crore in net profit (up 17%), a textbook tale of growth outpacing margin expansion — except the expansion is the real story. EBITDA margin jumped 210 basis points to 10.2%, a structural shift the company credits to data centre mix and higher-value solutions. The order book swelled to ₹2,964 crore as of May 30, 2026, promising 18–24 months of runway. Yet Q4 saw operating profit margin compress to 9.0% from 11.9% in Q3, a softness management calls temporary but investors are watching. The company is pivoting toward annuity revenue (Device-as-a-Service, managed services, Core Banking as a Service), which means bigger upfront capex and delayed profit recognition. Translation: strong tailwind, with execution risk front and centre.

2. Introduction

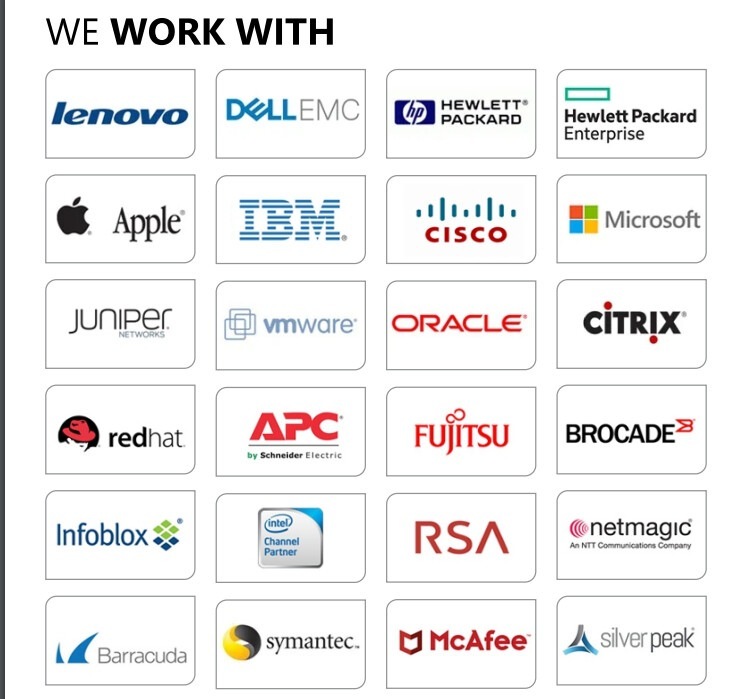
Dynacons, incorporated in 1995, is an Indian system integrator and managed services provider focused on data centre, cloud infrastructure, networking, security, and digital workplace solutions. It sells primarily to BFSI (52%), PSUs (36%), and global enterprises (12%), with 1,000+ employees and presence in 1,300+ locations across India. The company has earned premium partnerships with Microsoft, Cisco, Dell, HPE, Lenovo, VMware, and Nutanix — tier-one credibility in the vendor ecosystem.

FY26 was framed as a year of “strong execution and profitable growth.” Management secured several large wins: a ₹750.82 crore RBI private cloud deal, ₹249.15 crore RBI Enterprise Application Platform contract, ₹138.44 crore LIC digital workplace order, and ₹108.88 crore Punjab & Sind Bank cloud contract. The company also delivered the NABARD core banking rollout, enabling 38 banks to go live. In June 2026, Dynacons was ranked 63rd in TIME’s India’s Fastest-Growing Companies. On the vendor side, it received Lenovo’s DaaS Growth Partner of the Year award and recognition from Versa Networks and HPE for systems integration excellence.

3. Business Model: WTF Do They Even Do?

Dynacons bundles four interconnected revenue streams. Data Centre & Cloud Infrastructure (34% of FY26 revenue) designs, builds, and operates private clouds, hybrid cloud deployments, hyper-converged infrastructure, and AI-ready data centre environments. This segment grew 52% CAGR from FY21–26. Network & Security (12%) delivers SD-WAN, firewalls, SIEM, identity management, and 24/7 managed SOC services, with a 67% CAGR over five years. Digital Workplace Solutions (31%) handles VDI, device lifecycle management, endpoint security, and DaaS — the annuity lever management is banking on, albeit with only a 10% CAGR. Managed Services (23%) runs NOC/SOC operations, staff augmentation, and sector-specific offerings like Core Banking as a Service, growing at 32% CAGR.

The business model straddles two modes: project-centric (large EPC deals; upfront capex, milestone billing) and annuity-based (managed services, DaaS; recurring, lower-margin-per-deal but “sticky”). Management is deliberately shifting the mix toward annuity — hence the surge in Right-of-Use assets and lease liabilities in the balance sheet. This is a multi-year repositioning: short-term pain (asset-heavy, depreciation spike, longer receivables cycles) in service of long-term margin predictability.

The customer base is glued to legacy IT infrastructure (older banks, PSU data centres, government e-governance projects). Dynacons’ value is in owning the complex, un-sexy grind of migration, integration, and 24/7 support — not in flash, but in stickiness.

4. Financials Overview

Figures are consolidated, in ₹ crore.

Results Type: Annual (FY2026).

MetricFY2026FY2025YoY Growth
Revenue from Operations1,4241,267+12.4%
EBITDA*146103+41.4%
EBITDA Margin10.2%8.1%+210 bps
PAT8572+17.0%
EPS (₹)66.6457.01+17.0%

EBITDA excludes other income.

Full-Year Narrative:

Revenue grew 12% despite a modestly challenged Q4 (402 crore, +22% YoY, but EBITDA margin fell to 9.0% from Q3’s 11.9%). Management attributed Q4 margin pressure to supply-chain cost escalation tied to AI infrastructure demand and described it as transient. EBITDA margin expanded 210 basis points full-year, driven by a higher proportion of data centre projects (which carry better unit economics) and managed services attach. PAT grew slower than EBITDA, a sign of rising finance costs (₹23 crore in FY26 vs ₹11 crore in FY25) — the price of the annuity capex build.

From Concall (May/June 2026):

Management stated the margin expansion is “structural” and expects current levels to be “sustainable.” They acknowledged quarterly volatility (“margins may fluctuate”), but framed it as project-mix noise, not business deterioration. On Q4 specifically, they said supply-chain tightness is “the biggest risk that not only Dynacons, but every IT company in India would see,” and expected normalization as conditions improve. Notably, they refused to quantify the split between implementation revenue and O&M revenue for large orders (RBI, NABARD), citing confidentiality — so investors are flying blind on the timing of profit recognition for these mega-contracts.

5. Market Expectations & Historical Multiples

This section describes how the market is currently pricing the company and how that compares with its own history and peer group. It is descriptive, not predictive.

MetricCurrentHistorical Average (5Y)Peer Median
P/E19.5~2425.6
EV/EBITDA11.8~1318.0
ROE31.1%35.1%20.9%
ROCE29.7%~28%15.5%

The market currently pays 19.5x earnings, a discount to Dynacons’ own five-year median and well below the IT-services peer set (median 25.6x). On an EV/EBITDA basis, at 11.8x the company trades below its historical average and below peers at 18.0x. Return metrics are robust: ROE of 31% (vs a 5-year average of 35%) and ROCE of 30%, both multiples higher than the peer band, suggesting the market is pricing in the near-term capex intensity and working-capital drag from the annuity shift.

The valuation gap likely reflects two tensions: (1) uncertainty over the timing and margin contribution of the mega-orders (RBI ₹750.82 crore, NABARD ₹300+ crore committed), and (2) the spike in lease-related liabilities and ROU assets, which inflate the balance sheet and complicate debt metrics. The multiple sits at a discount to history, consistent with the market waiting for proof that the annuity transformation delivers the promised margin sustainability and cash conversion.

6. What’s Cooking

₹750.82 crore RBI Private Cloud Deal (5 years, go-live and O&M): Announced April 2026. Management refused to disclose the O&M vs implementation split or go-live timelines, citing confidentiality. This is the single largest order by far; execution will make or break FY27–28 earnings visibility.

₹249.15 crore RBI Enterprise Application Platform (5 years): Announced December 2025. Another large-scale deployment; execution rhythm and milestone realization will dictate quarterly results.

₹138.44 crore LIC Digital Workplace Solutions (multi-year): Announced FY26. Digital workplace is a lower-ROCE segment; high volume, modest margins.

₹125.88 crore Central Bank of India Private Cloud + GPU Infrastructure (5 years): Announced June 2026, post-FY26 close. AI-ready infrastructure, front-loaded capex.
NABARD Core Banking Rollout (38 banks live, more to follow): Announced as milestone achievement in concall. Government-backed, recurring, sticky — but constrained by legacy system complexity and regulatory pacing. No formal “phases,” just banks joining as contracts expire; management cited Haryana (20 banks added) and Telangana as live examples.

Device-as-a-Service (DaaS) Expansion & Strategic Partnerships: ₹74.99 crore Jammu & Kashmir Bank DaaS deal (9,851 desktops, 1,019 branches, 5 years). Lenovo partnership recognition. Management positioning DaaS as a key annuity lever; Nvidia’s Windows PC “superchip” (enabling local AI agents) expected to drive endpoint refresh cycles — though no numbers disclosed.

Cygeniq Partnership for AI-Driven Cybersecurity: Announced as partnership to deliver “AI for security and security for AI” solutions across India, Middle East, APAC. Positioning cybersecurity as a growth vector and differentiator in the bidding pipeline.

7. Balance Sheet

ItemFY2026FY2025FY2024
Total Assets1,013777587
Total Equity315231158
Total Liabilities698546429
Net Borrowings681730

Validation: Total Assets (1,013) = Total Equity (315) + Total Liabilities (698). ✓

The balance sheet has undergone a structural transformation. Non-current assets surged from ₹133 crore (FY25) to ₹235 crore (FY26), almost entirely due to ROU assets jumping from ₹64 crore to ₹90 crore (lease accounting for the Device-as-a-Service and Core Banking as a Service infrastructure). Property, Plant & Equipment also spiked from ₹8 crore to ₹68 crore — the DaaS device capex.

On the liability side, non-current lease liabilities ballooned from ₹64 crore to ₹114 crore, and current lease liabilities from ₹23 crore to ₹42 crore. Net borrowings (total debt minus cash) widened from ₹17 crore to ₹68 crore. Debt-to-Equity rose from 0.1x to 0.2x — still conservative, but the direction is steep.

Three Observations:

  1. The company is now an asset-heavy service provider. The lease accounting is turning operating leases into balance-sheet liabilities, making traditional leverage metrics look worse. Management noted this is “accounting treatment” and that commercial economics remain attractive, but they declined to disclose IRR or payback metrics for these annuity deals.
  2. Working capital is tightening. Trade receivables jumped from ₹437 crore to ₹602 crore (a 38% increase), while the company grew revenue only 12%. Management blamed this on milestone-based billing for large infrastructure projects (you can’t bill “% of completion”; you bill when infrastructure ownership transfers). Average debtor days extended from 126 to 155 days — a red flag for cash flow if projects slip.
  3. Cash on hand fell sharply. Cash and cash equivalents dropped from ₹35 crore to ₹13 crore. Combined with the capex surge and working-capital bloat, the company is relying on OEM/distributor credit and vendor financing to bridge the gap.

Wisdom: A balance sheet weighted with lease accounting and illiquid infrastructure assets doesn’t scream weakness — it signals a business in the throes of a structural pivot. The risk: if order book conversions slow or milestone payouts stall, the company will face a liquidity squeeze. The upside: once these DaaS and CBaaS projects reach steady-state O&M, recurring revenue and cash generation should improve dramatically.

8. Cash Flow: Sab Number Game Hai

ItemFY2026FY2025FY2024
Operating Cash Flow4,6136,6042,955
Investing Cash Flow(4,355)(2,795)(535)
Financing Cash Flow(2,440)(627)(1,159)
Free Cash Flow (OCF − Capex)2583,8092,420

Operating cash flow fell 30% year-over-year, despite PAT growing 17%. This divergence is the canary: working capital is eating cash. Trade receivables grew faster than revenue, and the company paid out ₹2,320 crore in finance costs (interest on the debt funding capex). Capex was a monster ₹6,500 crore, largely for DaaS devices and as-a-service infrastructure. Free cash flow (OCF minus capex) compressed to ₹258 crore from ₹3,809 crore — a 93% decline.

The Numbers Tell a Story: The company is printing profit (PAT up 17%) but burning cash (FCF down 93%). Why? Because large infrastructure orders front-load capex and receivables, and defer cash inflows to the O&M phase. This is intentional and, in theory, temporary — but if milestone payouts slip or the pipeline weakens, the company could face a working-capital crisis.

Wisdom: Free cash flow is the truest measure of a business’s financial health, and Dynacons’ FCF is alarming. Management will argue this is cyclical — big capex in FY26 (DaaS and CBaaS assets), with annuity cash flowing in FY27–28. That’s plausible. But it’s also the exact moment when a company is most vulnerable to execution slips.

9. Ratios: Sexy or Stressy?

RatioFY2026Interpretation
ROE31.1%Equity earned a profit of ₹31.10 per hundred; tracking at the upper end of the company’s 5-yr historical range (35.1%). The dip reflects higher equity base (₹315 cr vs ₹231 cr) from retained earnings, not a collapse in profitability.
ROCE29.7%Capital earned 29.7% return; well above the cost of capital (~8–10%) and above peers (~15%). But the metric is coming off a peak of 44% in FY24, a function of the asset build.
P/E19.5Market pays ₹19.50 for every rupee of annualized earnings; below peer median of 25.6x. A discount, but justified by execution risk.
PAT Margin6.0%For every ₹100 in revenue, ₹6 becomes profit. Stable vs FY25 (5.7%); EBITDA margin is the growth story, not the bottom line.
D/E0.2xNet debt is 0.2x equity; conservative. The lease liabilities make this look worse than operational economics, but even on a gross debt basis (borrowings excluding leases), the company is at ~0.1x — very safe.

Parsing the Ratios:

ROCE is the most informative metric here. At 30%, it’s world-class — the business is generating a 30% return on capital employed, nearly 3x the cost of capital. But ROCE has slipped from the 44% peak in FY24, a sign that the new capex-heavy model (DaaS, CBaaS) earns lower returns initially (they’re front-loaded with capex, back-loaded with O&M cash). This is expected, but it sets a low bar for what “structural margin sustainability” means. If annuity returns normalize at 20–25% ROCE (still excellent), management’s confidence is justified. If they fall below 15%, the pivot becomes questionable.

ROE at 31% is strong but drifting downward. Equity is growing (dilution from retained earnings), but EPS growth is faster (17% vs ~8% equity growth), so ROE isn’t collapsing — just normalizing as scale increases. This is healthy, not a concern.

The D/E ratio of 0.2x is misleading. Strip out lease liabilities (which are quasi-debt), and the company is barely levered at all. But leases are real obligations; management can’t ignore them. At 0.2x, leverage is very manageable, leaving substantial borrowing capacity for M&A or further capex, if needed.

10. P&L Breakdown: Show Me the Money

YearRevenue (₹ cr)EBITDA (₹ cr)PAT (₹ cr)
FY20241,0247854
FY20251,26710372
FY20261,42414685
CAGR (3Y)18.2%36.5%24.8%

The Trajectory:

Revenue is on a steady clip: 24% growth (FY24→25), 12% growth (FY25→26). The deceleration is partly cyclical (large deals in prior years lumpier than recurring revenue), partly structural (saturation in the traditional SI market). EBITDA growth, however, is the headline: 32% in FY25, 41% in FY26. This is the operating leverage story — the company is extracting more profit from incremental revenue. But here’s the catch: PAT growth (10% FY25, 17% FY26) is lagging EBITDA growth because finance costs are rising (₹11 cr in FY25 to ₹23 cr in FY26), a direct result of the capex debt funding. Depreciation also spiked (₹2 cr to ₹15 cr), reflecting the asset build.

What This Means: The company’s operating business is improving (EBITDA margin up 210 bps), but the bottom line is being headwind by capital structure decisions (debt, depreciation). This is intentional — management is choosing to invest in annuity assets now, betting on amortized returns later. If the annuity strategy works, FY27–28 should see PAT growth re-accelerate as depreciation normalizes and finance costs stabilize (on a higher asset base but lower incremental debt). If it doesn’t, the company is stuck with a bloated balance sheet and declining ROCE.

11. Peer Comparison

CompanyRevenue (₹ cr)PAT (₹ cr)P/E
L&T Technology36,0633,32726.7x
Tata Technolog.31,2032,04250.9x
Inventurus Knowl28,6452,06539.8x
Netweb Technol.26,541706129.0x
Dynacons Sys.1,6578519.5x
Median (peer set)28,6452,06525.6x

Dynacons is a minnow in a pond of sharks. It’s 30–40x smaller than the top-tier SI peers on a revenue basis, yet its P/E of 19.5x is lower than the peer median of 25.6x. The comparison is almost unhelpful because scale matters in SI — larger players have better OEM leverage, global reach, and higher margins. But within the mid-market SI space (₹1,000–5,000 crore revenue), Dynacons is a player: growing faster than peers, with ROCE above the peer band, and trading at a valuation discount to similarly-sized competitors.

The Nuance: Dynacons sits between two worlds — too large to be a high-growth boutique, too small to have the pricing power of a Tata Technologies or L&T. Its survival and upside depend on two things: (1) staying ahead of the consolidation curve (i.e., not being acquired as a roll-up asset), and (2) proving the annuity shift can yield the promised margin stability. If it achieves both, a re-rating to 25–30x P/E is plausible. If it falters on execution, it could drift down to 12–15x as the market re-prices for lower ROCE and execution risk.

12. Miscellaneous: Shareholding & Promoters

HolderStake %
Promoters60.9%
FIIs0.37%
DIIs0.30%
Public38.45%

Promoter Breakdown:

The core promoters are the Anjaria family and Dalal family, with Trigem Infosolutions (16.4%, likely a family-controlled entity) as a major shareholding. Shirish Mansinh Anjaria (9.1%), Parag Jitendra Dalal (8.6%), and Dharmesh Shirish Anjaria (7.5%) are the named individuals. Promoter holding has drifted down marginally (61.1% to 60.9% over the past 3 years), likely due to public share acquisitions, but control remains firm.

Promoter Pedigree: Shirish Anjaria, founder and Chairman, has 50+ years of business experience and forged alliances with Intel, IBM, HP, and Microsoft — the foundational partnerships that enabled the company to scale. His playbook is vendor-led distribution and system integration, a proven model in the ’90s–’10s. Parag Dalal and Dharmesh Anjaria are second-generation leaders with operational depth (35+ and 28+ years respectively). The board also includes independent directors with IT and finance backgrounds, reducing the family-office risk.

The Roast: Promoters have skin in the game (61% holding), which aligns incentives. But the lack of diversification in the shareholder base (FIIs + DIIs = 0.67%, nearly invisible) suggests institutional investors aren’t convinced, either because the story is too complex, the execution risk is too high, or the scale is too small. If Dynacons wanted to re-rate, attracting institutional capital would be step one. The public float (38.45%) is enough for index inclusion and liquidity, but not enough to drive momentum. Promoters could unlock value by gradually reducing stake (signalling conviction in the business without promoter pump) and bringing in strategic or financial sponsors, but they’ve shown no appetite for that to date.

13. Corporate Governance: Angels or Devils?

Auditors: M/s MS P & Co., Chartered Accountants, issued an unmodified audit opinion on both standalone and consolidated FY26 results. No red flags in the audit report; the financial statements were prepared in accordance with Ind AS and SEBI Listing Regulations.

Board: Five directors (three executive, two independent) plus a Company Secretary. The board includes a finance CFO (Dharmesh Anjaria) and independent directors with audit/tax expertise (Falguni Shah, CA; Ashok Bhumaiah Rajagiri, CA with 33+ years experience). The Audit Committee structure appears sound, and the Board approved the financials without dissent.

Pledges: Zero pledge data disclosed; promoter stake is unencumbered. This is a positive signal — if the promoters aren’t leveraging their shares, they’re not under financial stress.

Related-Party Transactions: Not flagged in the filings examined. The company has OEM partnerships (Microsoft, Cisco, etc.) but these are supplier relationships, not related-party revenue leakage.

Resignations / Tax Demands / Credit Ratings: No major resignations or tax litigation disclosed. Credit ratings remain stable; CARE and SMERA have both reaffirmed investment-grade ratings (AA– range) with stable outlook as of late 2024/early 2025.

Conclusion: Governance is competent, with experienced directors and clean audit reports. The lack of institutional representation on the board is a minor gap — adding an independent investor or global executive would strengthen credibility with institutional buyers. But there are no red flags (pledges, prosecutions, tax disputes) that would trigger a downgrade.

14. Industry Roast & Macro Context

India’s IT services and solutions market is expected to reach USD 176 billion by 2026, growing at 11% CAGR. Within that, data centre spending is the fastest-growing segment (~20.5% growth), followed by workplace IT devices (~11%) and managed/professional services (~9.9%).

The Sector’s Structural Tailwinds:

  1. Digital transformation in PSUs and BFSI. Legacy systems are crumbling; banks and government agencies are forced to modernize. Dynacons sits squarely in this middle-market refresh cycle, undercutting large players on price and outmaneuvering smaller boutiques on execution.
  2. Data localisation and sovereign cloud. Government directives requiring data residency in India are driving capex into domestic data centre infrastructure. Dynacons has the partnerships (HPE, Dell, Cisco) to deliver on this mandate.
  3. AI workload acceleration. Nvidia’s chip scarcity and rising demand for AI-ready infrastructure is inflating capex budgets. The company’s partnership with Cygeniq for AI-driven security and its positioning around AI infrastructure are well-timed.
  4. Hybrid/multi-cloud adoption. Enterprises are avoiding single-cloud lock-in and deploying workloads across on-prem, private cloud, and public cloud. The complexity of this orchestration drives SI demand.

The Sector’s Headwinds:

  1. Supply chain tightness. Management cited this as “the biggest risk that every IT company in India would see.” Semiconductors (GPUs, CPUs), optical components, and networking gear are all constrained, driving up component costs. Q4’s margin compression is a direct result. This is cyclical but painful in the near term.
  2. Vendor margin pressure. As OEM volumes grow, their margins compress, and they push cost escalations downstream to SIs. Dynacons is in the middle — they can’t pass all costs to customers (fixed-price contracts), but they can’t absorb them indefinitely (fixed margin targets). The concall hinted at tactical bidding behavior to win deals, which is a margin killer.
  3. Competition from larger players. L&T, Tata Tech, and global firms (Accenture, HCL) are all moving downstream into SI and managed services. Dynacons’ scale advantage is at risk if a larger player decides to consolidate the mid-market.
  4. Regulatory scrutiny. Labour code changes, environmental compliance (e-waste, energy efficiency), and data privacy regulations are raising the cost of doing business. The company noted it doesn’t expect “material impact” from the new labour codes, but sustained regulation will whittle margins.

The Roast: The SI market is structurally sound but brutally competitive. Dynacons’ “un-sexy” positioning — boring data centre integrations, compliance work, legacy system migrations — is actually its strength. It’s not flashy, but it’s sticky. The risk is that a larger player (L&T, Tata Tech, or a global firm) decides to disrupt the mid-market by bundling SI with managed services at scale. That moment is coming, and Dynacons’ window to consolidate or be consolidated is narrowing.

15. EduInvesting Verdict

DimensionStrengthWeaknessOpportunityThreat
Growth27% revenue CAGR, FY21–26; order book visibility ₹2,964 crGrowth decelerated to 12% YoY in FY26; top-line saturation in traditional SIAnnuity shift (DaaS, CBaaS) can re-accelerate growth to 15–20% by FY27–28Consolidation by larger players; SI market commoditization
ProfitabilityEBITDA margin expanded 210 bps to 10.2%; ROCE 30%, well above cost of capitalPAT margin flat at 6%; finance costs rising; FCF down 93% YoY due to capexAnnuity scale-up will improve cash conversion; operating leverage on recurring revenueQ4 margin compression signals supply-chain inflation; structural sustainability unproven
Balance SheetDebt-to-Equity 0.2x, conservative; promoter stake unencumbered; 1,300+ execution locationsAsset-heavy model (₹235 cr non-current assets); lease liabilities spike (₹156 cr); working capital deterioration (receivables +38% vs revenue +12%)Annuity capex now = operational cash flows later; OEM/distributor credit bridges gapWorking capital squeeze if order book conversions slip; liquidity pressure in FY27
ExecutionMarquee wins (RBI ₹750 cr, LIC ₹138 cr); NABARD CBaaS rollout (38 banks live); vendor recognition (Lenovo, HPE, Versa)Refusal to disclose O&M vs implementation splits for mega-orders; no go-live timelines disclosedBFSI digital transformation pipeline; APAC/Europe expansion; inorganic M&A for AI/security capabilitiesRBI order complexity; milestone-based billing risk; execution timeline slips could crater FY27 earnings
ValuationP/E 19.5x vs peer median 25.6x; trading below 5-yr historical averageDiscount reflects execution risk and balance-sheet opacity; valuation multiple at risk if ROCE deterioratesRe-rating to 25–30x P/E if annuity transformation delivers promised ROCE; margin sustainability proofDowngrade to 12–15x P/E if capex yields poor returns and cash flow remains under pressure

A balance sheet with nothing to hide, a multiple with everything to prove. Dynacons is a competent mid-market system integrator navigating a high-stakes transition from project-centric SI to annuity-led managed services. The order book is robust, the vendor partnerships are elite, and the market tailwind (data centre refresh, AI infrastructure, PSU transformation) is real. But the pivot toward capex-heavy DaaS and CBaaS has front-loaded the pain: working capital is bloated, free cash flow is cratering, and the company is betting that milestone payouts and annuity scaling will justify the balance-sheet burden. Execution — specifically, timely go-lives and milestone realization on the RBI, NABARD, and LIC mega-orders — will determine whether the margin expansion is structural or cyclical. The market’s 19.5x P/E discount to peers reflects this tension: a company w

Leave a Reply
