Dr Agarwals Eye Hospital Ltd Mar 2026: 35.2x P/E on 25.2% ROE Ahead of Q2FY27 Megamerger
Section 1 — At a Glance
Dr Agarwals Eye Hospital Limited delivered ₹470.87 Cr of revenue from operations for the full year ended March 31, 2026, marking an 18.6% increase over the previous fiscal. Profit after tax expanded to ₹70.10 Cr, translating into a reported basic EPS of ₹147.02. This operational scaling was supported by an expanding healthcare footprint, with the listed entity’s network increasing to 63 facilities and an aggregate clinical team of more than 230 doctors.
Investor interest remains anchored to the company’s impending structural transformation. The Board of Directors has approved a scheme of amalgamation to merge the listed entity into its parent organization, Dr. Agarwal’s Health Care Limited, with an expected completion timeline set for the second quarter of financial year 2027. While top-line compounding has maintained high velocity, operational metrics highlight architectural transitions; capital work-in-progress expanded significantly to ₹197.32 Cr as of March 31, 2026, reflecting intensive investment in long-gestation assets such as the Cathedral Road flagship Center of Excellence.
Concurrently, risk dimensions warrant systematic tracking. Total promoter shareholding stands at 72.67%, but a substantial 29.3% of the promoter group’s equity position is encumbered through pledges to secure corporate financial facilities. Furthermore, the business model continues to carry geographic vulnerability, with the structural revenue mix heavily indexed toward facilities located across southern India.
Capital misallocation can slowly compromise an enterprise long before the core operational infrastructure begins to reflect material distress.
The primary operational entity’s financial stability, balance sheet leverage ratios, and earnings conversion efficiency will determine whether this ongoing scaling trajectory can be sustained as the organization transitions into a unified corporate platform.
Section 2 — Introduction
Dr Agarwals Eye Hospital Limited has functioned as a primary corporate vehicle within the Indian ophthalmology domain since its incorporation in 1994. From its historical operational base in Chennai, the enterprise has constructed a specialized clinical delivery network that spans multiple tiers of ophthalmic care. The structural orientation of the corporate entity is currently in a state of deliberate transition, driven by corporate actions intended to consolidate parallel corporate structures.
The company’s corporate identity is tied to its position as a subsidiary of Dr. Agarwal’s Health Care Limited, which maintains a clear majority ownership stake. Strategic initiatives executed during the current fiscal year have focused heavily on infrastructure expansion within regional clusters, deploying a mix of comprehensive surgical centers and localized clinical touchpoints. This operational design is intended to aggregate patient traffic into centralized surgical units while managing the capital intensity of the overall network.
Section 3 — Business Model: WTF Do They Even Do?
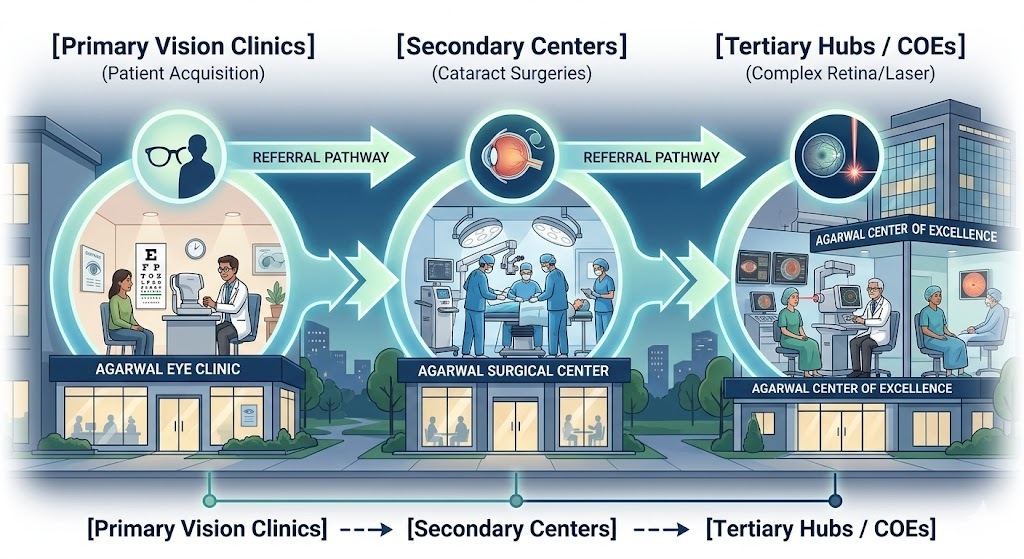
At its core, this business functions by treating the human eyeball as a highly specialized, recurring maintenance asset. They operate an asset-light, hub-and-spoke medical framework designed to extract maximum clinical yield with minimal real estate ownership. The corporate machinery splits into primary vision clinics (the spokes) that handle basic diagnostic assessments and act as customer acquisition funnels, routing anything requiring serious medical intervention to secondary and tertiary surgical hubs.
The revenue architecture confirms that surgeries are the clear engine of this business, generating 63.9% of the top line. Cataract procedures remain the undisputed heavyweight champion of the P&L, enjoying a structural tailwind as the macroeconomic demographics of the domestic market continue to age. The remaining performance is split between selling high-margin prescription lenses and optical accessories at 23.2%, and keeping the lights on with consultations and basic diagnostic imaging at 12.8%. It is an efficient model, provided you can keep a steady supply of highly skilled surgeons from being poached by competing hospital networks.
Section 4 — Financials Overview
Figures are consolidated, in ₹ crore.
Headline Performance Metrics
Metric
Latest Quarter (Mar 2026)
YoY
QoQ
Revenue
120.01
20.2%
3.3%
EBITDA / Operating Profit
34.00
41.7%
0.0%
PAT
16.24
24.9%
-6.0%
EPS
33.60
23.5%
-6.0%
The top line achieved a solid 20.2% expansion relative to the corresponding quarter of the previous fiscal year, pointing to steady patient traffic volumes across the core network. However, the sequential profit numbers show that clinical execution is not entirely