1. At a Glance
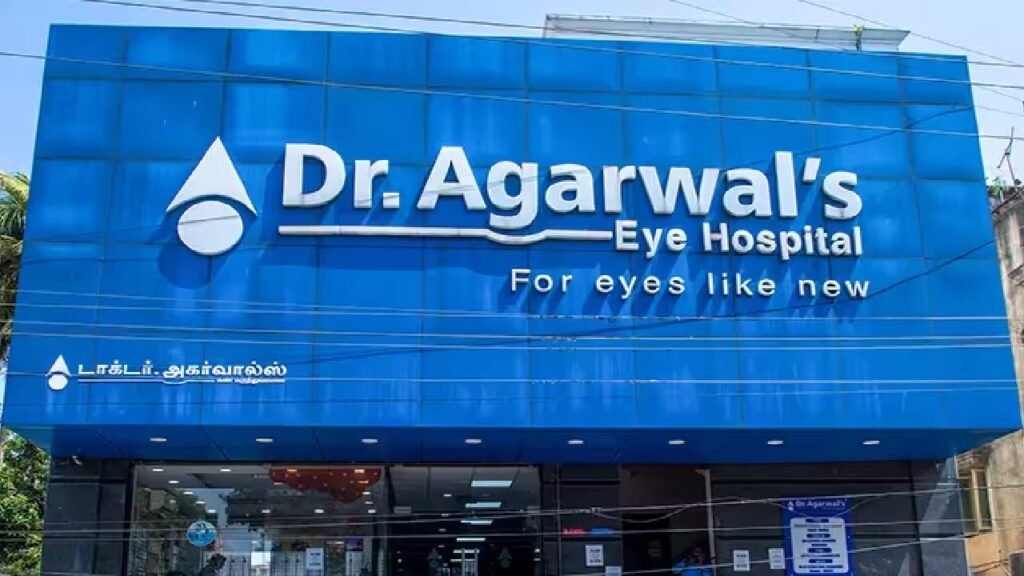
A Tamil Nadu titan in ophthalmology, Dr Agarwal’s Eye Hospital isn’t just checking eyes — it’s checking in record profits. With a32% CAGR profit growth over 5 yearsandROE brushing 30%, the company is sharper than a LASIK beam. But before you blink twice, remember — overhalf of promoter holdings are pledged, which in finance-land is the equivalent of walking around with one contact lens missing.
2. Introduction
Founded in Chennai and now a brand synonymous with eye care across South India, Dr Agarwal’s Eye Hospital has transitioned from a single clinic to a specialized healthcare chain.
It’s not Apollo in size or Max in market cap, but in niche dominance, this chain punches above its weight. Every year, more people are walking out of their centers seeing the world clearly — and shareholders are walking out seeing their portfolio a little brighter.
However, like any good medical drama, there’s a subplot: high valuation multiples, pledged shares, and the fact that the stock trades at10x book value— because apparently, market optimism also needs glasses.
3. Business Model – WTF Do They Even Do?
The company operates specialty hospitals focused on:
- Cataract surgeries
- Glaucoma treatments
- Laser correction & refractive surgeries
- Retina & cornea care
- Squint correction & pediatric ophthalmology
Revenue model:Pure-play healthcare services with high-margin surgical procedures, OPD consultations, and diagnostic services.
Moat:Specialist brand recall, high-quality care, and decades of trust in Tamil Nadu (with increasing reach in other states).
Roast: It’s a one-trick pony — but that one trick is performed with surgical precision and charged like it’s Cirque du Soleil.
4. Financials Overview
FY25 Annual
- Revenue:₹397 Cr (+24% YoY)
- EBITDA:₹118 Cr (EBITDA Margin ~30%)
- PAT:₹55 Cr (+19% YoY)
- EPS:₹116.28
- P/E:~36.7x
Q1 FY26:
- Revenue: ₹116.92 Cr (+17% YoY)
- PAT:
- ₹17.26 Cr (+22% YoY)
- EPS: ₹36.72
P/E Recalc:
- Q1 EPS ₹36.72 × 4 = ₹146.88 annualized
- CMP ₹4,515 ÷ 146.88 ≈30.7x(cheaper than trailing P/E due to strong growth).
Margins have consistently stayed at 28–32% OPM — an unheard-of luxury in broader hospital chains that rely on high-volume, low-margin work.
5. Valuation (Fair Value RANGE)
Method 1 – P/E Approach
- Industry average for specialized healthcare: 30–40x.
- Applying 28–35x to FY26E EPS ₹146.88 → ₹4,112 – ₹5,141.
Method 2 – EV/EBITDA
- FY25 EBITDA: ₹118 Cr.
- Applying 20–24x → EV ₹2,360 – ₹2,832 Cr.
- Adjust for debt (
₹333 Cr) and cash (₹94 Cr) → Equity value: ₹2,121 – ₹2,593 Cr. - Per share (~47.0 lakh shares): ₹4,512 – ₹5,515.
Method 3 – DCF (Simplified)
- FCF ~₹60 Cr, growth 18% for 5 years, terminal 5%, discount 11% → ₹4,300 – ₹4,800.
| Method | FV Low | FV High |
|---|---|---|
| P/E | 4,112 | 5,141 |
| EV/EBITDA | 4,512 | 5,515 |
| DCF | 4,300 | 4,800 |
Fair Value Range:₹4,300 – ₹5,150This FV range is for educational purposes only and is not investment advice.
6. What’s Cooking – News, Triggers, Drama
- Q1 FY26:Revenue
