Dev Accelerator Ltd FY26: Squaring the Circle of 48% EBITDA and a 2x Debt-to-Equity Multiplier
Section 1 — At a Glance
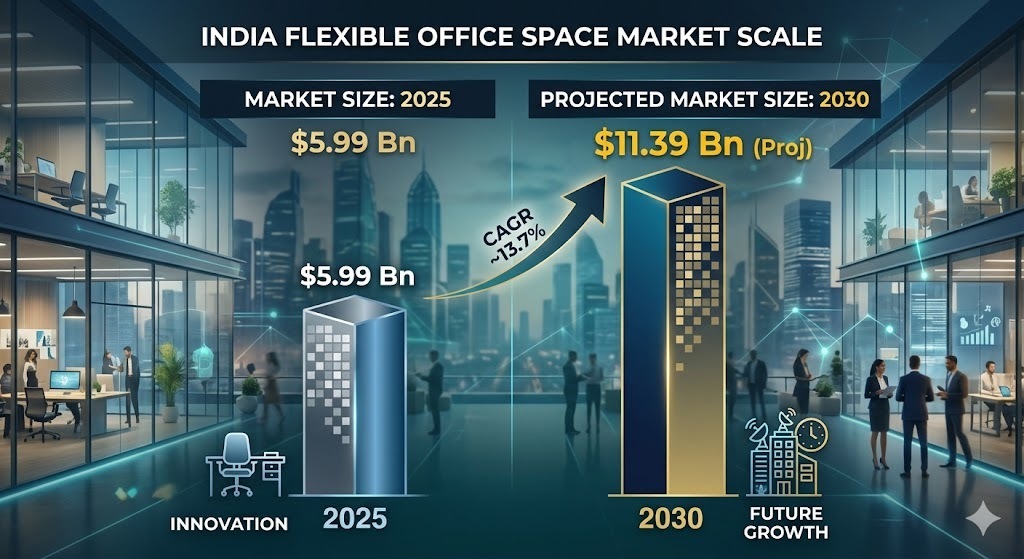
Dev Accelerator Ltd (DevX) closed the fiscal year ending March 31, 2026, with a consolidated top-line expansion of 42.2%, matching total revenue from operations to ₹225.92 crore. Consolidated net profit for the same period staged a sharp ascent to ₹8.80 crore. While headline operational indicators show structural momentum—highlighted by an expanded asset footprint of 0.83 million square feet under management and portfolio occupancy moving to peak levels at 90.31%—the underlying capital architecture presents distinct pressure points.
Investor focus remains divided between the platform’s execution capability in Tier-2 growth hubs and its leveraged balance sheet. The company successfully scaled its core workspace solutions while implementing a development management model designed to limit incremental capital expenditures. However, total borrowings remain high at ₹370.41 crore, causing a debt-to-equity ratio of 2.00x and keeping the current interest coverage ratio tight at 1.35x.
High operational margins are only as good as the capital structures that fund them; leverage magnifies returns in expansionary phases but compresses security thresholds during operational delays.
The core question going forward is whether the platform can successfully execute its 2.76 lakh square feet near-term pipeline and sustain its rent-to-revenue efficiency as it builds out institutional Grade-A inventory.
Section 2 — Introduction
Dev Accelerator Ltd has rapidly positioned itself as a key architectural framework for regional enterprise consolidation across India’s Tier-2 landscape. This article is written following the disclosure of the company’s audited full-year and fourth-quarter corporate earnings for FY26. This milestone marks its first complete financial year operating as a publicly listed corporate entity following its public market debut on September 17, 2025.
The company is deploying capital raised via its fresh equity issue to aggressively fund expansion initiatives. It has targeted key micro-markets where commercial real estate supply remains highly fragmented. Rather than chasing speculative, hyper-competitive multi-tenant occupancy inside metropolitan Tier-1 city centers, the platform has intentionally anchored its long-term operational runway within rapid-growth regional industrial nodes. This structural pivot forms the foundation of its ongoing growth phase.
Section 3 — Business Model: WTF Do They Even Do?
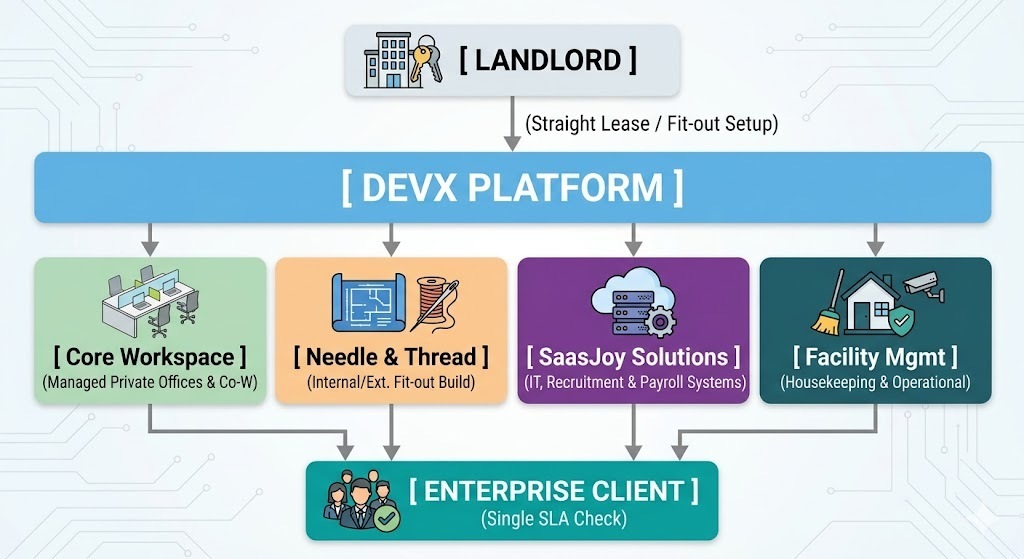
DevX operates an outsourced corporate ecosystem, acting as a real estate solutions layer under a single consolidated service level agreement. Stripped of the polished marketing jargon, the company leases bare shell real estate, fits it out with corporate infrastructure, and charges enterprise clients premium yields for an entirely managed workspace environment.
The model functions through a highly integrated, self-reinforcing corporate services flywheel:
Managed Office Solutions: Generates 59% of headline top-line performance by supplying built-to-suit private enclosures under 5-to-9-year corporate tenures.
Design & Execution (Needle & Thread Designs): Contributes 25.5% of absolute revenue, functioning both as an internal fit-out engine to lower setup timelines and an external commercial agency.
Technology & Ancillary Sub-segments: Consists of SaasJoy Solutions (5% revenue share from enterprise IT developments and cloud analytics) along with facility management and structured payroll networks.
The corporate thesis builds on locking in stable demand from Global Capability Centers (GCCs), which account for 65% of the company’s total active client revenue mix.
Section 4 — Financials Overview
Figures are consolidated, in ₹ crore.
Performance Tracker
Metric
Latest Quarter (Q4 FY26)
YoY Change (%)
QoQ Change (%)
Revenue
59.26
-9.39%
+0.10%
EBITDA / Operating Profit
32.48
+3.74%
+35.84%
PAT
7.90
+272.64%
+897.98%
EPS (₹)
0.88
+183.87%
+900.00%
Note: Relative historical periods are adjusted using proportional weights based on disclosed standalone base matrices, raw quarterly trends, and sharecapital movements.
Did Management Walk the Talk?
Reviewing the historical commentary from the February 2026 analyst engagement shows mixed execution signals. Management highlighted structural pre-leasing momentum for the newly scaled 3.15 lakh square feet “Capital One” facility in Ahmedabad. They noted