1. At a Glance
Deccan Cements is a mid-cap cement maker with an identity crisis – part cement manufacturer, part power producer, fully priced like it’s sitting on a gold mine. FY25 saw ₹505 Cr in sales, ₹20 Cr PAT, and a P/E north of 73. In other words: revenue like a small-town builder, valuation like a startup that just added “AI” to its name.
2. Introduction
Cement is supposed to be boring – steady demand, incremental capacity additions, boring valuations. But Deccan Cements apparently missed that memo.
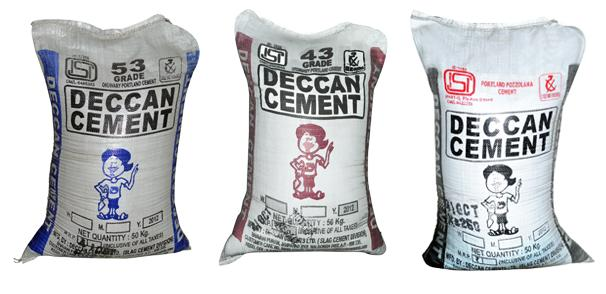
Born in 1979 and based in Telangana, the company produces all major grades – OPC, PPC, PSC, plus specialty variants like sulphate-resistant and oil well cement. It also has hydel and wind power assets, because why not diversify into something equally capital-heavy?
But here’s the drama – sales growth over the past 5 years is actuallynegative (-1%), profit growth is even worse (-35% CAGR), ROCE has fallen to1.76%, yet the stock has shot up over 62% in one year. Either there’s a turnaround brewing… or this is pure liquidity-fuelled FOMO.
3. Business Model (WTF Do They Even Do?)
Deccan’s model is textbook cement:
- Products:OPC (33/43/53 grades), PPC, PSC, specialty cement (rapid hardening, high alumina, oil well cement).
- Markets:Construction, infrastructure, marine works, coastal projects.
- Capacity:Small compared to the giants – think a scooter in a Ducati race.
- Side Hustle:Power generation from hydel and wind, partly for captive use, partly sold to the grid.
Revenue split: Cement drives the bulk, power is supplementary. Competitive edge? Mostly regional pricing and specialty grades in niche
demand pockets.
4. Financials Overview
- TTM Sales:₹505 Cr
- TTM PAT:₹20 Cr
- EPS:₹14.34
- P/E:73.6
- ROE:1.04%
- ROCE:1.76%
- OPM:~10%
Sales peaked at ₹799 Cr in FY24 before plunging to ₹527 Cr in FY25 – that’s a 34% fall. PAT cratered from ₹37 Cr to ₹8 Cr in FY25, and TTM has recovered to ₹20 Cr. The company’s margins have gone from 20% in FY21 to single digits in FY25, with inventory days bloating to 541 – cement’s version of unsold flats.
5. Valuation (Fair Value RANGE)
Method 1 – P/EEPS = ₹14.34Sector P/E range for mid-cap cement: 18–25FV = ₹258 – ₹359
Method 2 – EV/EBITDAEBITDA (TTM) ≈ ₹52 CrNet Debt ≈ ₹714 Cr borrowings – (assume low cash) ≈ ₹700 CrEV ≈ ₹2,178 Cr at CMPSector EV/EBITDA range: 8–10× → FV ≈ ₹180 – ₹225 per share.
Method 3 – DCF


