


At a Glance
DE Nora India Ltd, a small-cap electrochemical wizard under the Italian De Nora Group, posted a Q1 FY26 that screams “expensive boutique” rather than “mass production.” The stock trades at a nosebleed P/E of ~250, while profitability is crawling like it’s on vacation. Sales doubled YoY in Q1, but operating profit margin tanked to 5.8%, proving growth without profit is just a gym selfie. Promoters hold a tight 53.68%, public clings to 46%, and FIIs barely exist. With cash flows wobbling and inventory days ballooning to 400+, investors might need to meditate before holding this.
Introduction
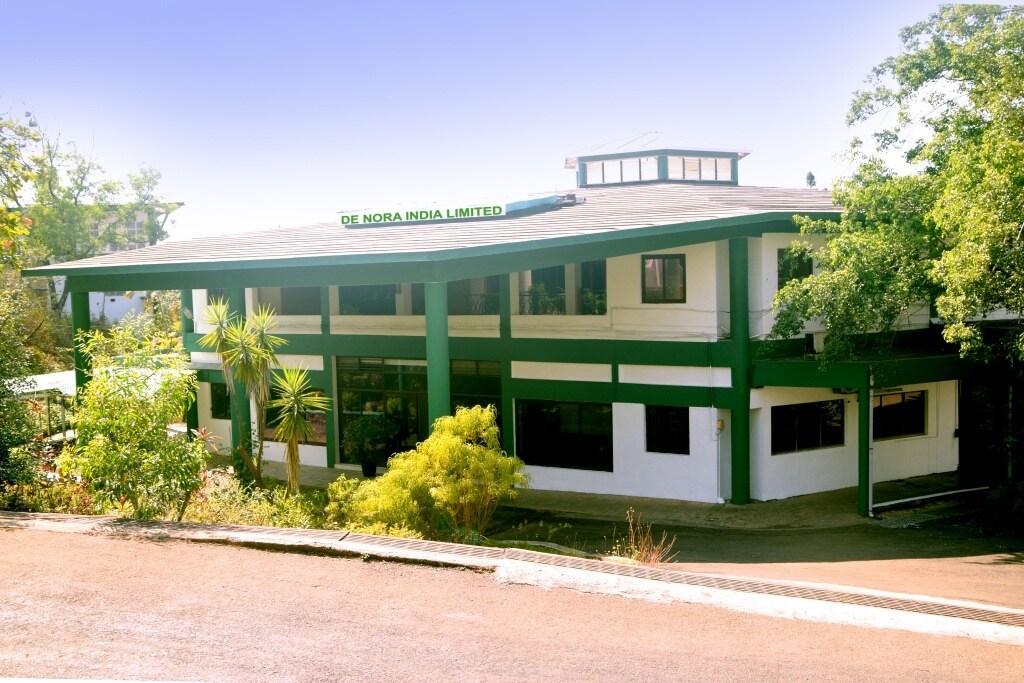
Imagine a company that brings Italian electrochemical tech to India but manages returns that make savings accounts look adventurous. DE Nora India (DNIL) is that rare stock: glamorous parentage, futuristic products, and financials that make you question your life choices. The Q1 FY26 results reveal sales skyrocketing to ₹41.9 crore (from ₹12.7 crore a year ago), but net profit is just ₹3.25 crore—yes, still pocket change.
Despite negligible debt, cash flow resembles a leaky faucet, with operating cash last year at a meager ₹3.1 crore. Add in working capital days of 403 (basically holding cash hostage), and you see why the market is playing hot potato with this stock. But hey, P/E 250 means people are paying luxury prices for a company that’s still figuring out how to make money consistently.
Business Model (WTF Do They Even Do?)
DNIL manufactures and recoats noble metal-coated electrodes and electrolyzers used in the Chlor-alkali industry. Translation: they make stuff that helps make chlorine, caustic soda, and other industrial chemicals, plus tech solutions for electrochemical industries. Parent company Oronzio De Nora, with its 24 global subsidiaries, supplies cutting-edge tech. DNIL imports expertise but exports… patience.
The business is highly niche, capital-intensive in R&D, and dependent on industrial demand cycles. While tech sounds premium, the customer base is limited, creating feast-or-famine revenue streams. Essentially, DNIL is that brilliant kid in class who knows everything but forgets to submit assignments—great potential, questionable execution.
Financials Overview
| Particulars (₹ Cr) | FY23 | FY24 | FY25 | Q1 FY26 |
|---|---|---|---|---|
| Revenue | 73.6 | 73.8 | 68.6 | 41.9 |
| EBITDA | 24.7 | 21.4 | -1.4 | 2.4 |
| PAT | 20.3 | 19.0 | 1.7 | 3.25 |
| OPM % | 33.7% | 29.0% | -2.0% | 5.8% |
| ROE % | 20% | 12% | 1% | 1.4% (TTM) |
Commentary: Revenue jumped in Q1 FY26, but profits remain fragile. FY25 saw negative margins—a crime in the capital markets. ROE at 1.4% is like running a marathon only to collapse at the finish line. Other income (₹6.9 Cr TTM) props up earnings like duct tape.
Valuation
Let’s do some math (and cry):
- P/E Method:
EPS TTM ≈ ₹3.9 → At P/E 40 (industry median) → Fair value ≈ ₹156.
Current P/E 250 → Clearly overpriced. - EV/EBITDA:
EBITDA TTM ≈ -₹1.9 Cr → EV/EBITDA meaningless (negative). - DCF (simplified):
Assume FCF ₹5 Cr, growth 10%, WACC 10% → Fair value ≈ ₹180–₹200.
Fair Value Range: ₹150–₹200 (versus CMP ₹970). Investors paying current price must either love Italian tech or hate their money.
What’s Cooking – News, Triggers, Drama
- Q1 FY26: Sales up 229% YoY, profits still tiny.
- Capex? Minimal.
- Parent Support? Technology transfers continue, but no mega projects announced.
- Risks: High inventory days, poor cash cycle, inconsistent margins.
- Potential Triggers: Industrial demand revival, new electrode contracts, parent company tech upgrades.
Balance Sheet
| Assets | FY25 |
|---|---|
| Total Assets | ₹142 Cr |
| Net Worth | ₹120 Cr |
| Borrowings | ₹0 Cr |
| Liabilities | ₹22 Cr |
Remarks: Almost debt-free, but liquidity management is a nightmare. Inventory hoarding makes cash evaporate.
Cash Flow – Sab Number Game Hai
| ₹ Cr | FY23 | FY24 | FY25 |
|---|---|---|---|
| Operating CF | 14.3 | 16.1 | 3.1 |
| Investing CF | -23.8 | -13.6 | 0.7 |
| Financing CF | -0.5 | -1.1 | -1.1 |
Remarks: Cash flow collapsed in FY25, despite zero debt. Money comes in, waves, and leaves.
Ratios – Sexy or Stressy?
| Ratio | FY25 |
|---|---|
| ROE | 1% |
| ROCE | 2.3% |
| P/E | 250 |
| PAT Margin | -2% |
| D/E | 0.0 |
Remarks: These ratios scream stress. Investors betting on DNIL are basically adrenaline junkies.
P&L Breakdown – Show Me the Money
| ₹ Cr | FY23 | FY24 | FY25 |
|---|---|---|---|
| Revenue | 73.6 | 73.8 | 68.6 |
| EBITDA | 24.7 | 21.4 | -1.4 |
| PAT | 20.3 | 19.0 | 1.7 |
Remarks: FY25 was a financial hangover. Q1 FY26 looks like a mild recovery, but still fragile.
Peer Comparison
| Company | Rev (₹ Cr) | PAT (₹ Cr) | P/E |
|---|---|---|---|
| Graphite India | 2,560 | 455 | 24 |
| Vesuvius India | 1,897 | 255 | 41 |
| HEG | 2,205 | 197 | 52 |
| DE Nora India | 98 | 2 | 250 |
Remarks: DNIL’s P/E is a cosmic outlier. Others earn real profits.
Miscellaneous – Shareholding, Promoters
- Promoter Holding: 53.68% (steady)
- FIIs: 0.03% (they ran away)
- DIIs: 0.22%
- Public: 46.06% (mostly hopeful retail)
Promoters are Italian; retail investors are Indian dreamers. No M&A, no IPO drama, just quiet suffering.
EduInvesting Verdict™
DNIL is like a Ferrari with a scooter engine. The tech pedigree is strong, but financial performance is weak. The Q1 FY26 spike in revenue is promising, but unless margins recover, this stock remains a speculative toy. At P/E 250, the market prices in perfection, which DNIL is nowhere close to delivering.
SWOT Analysis
- Strengths: Tech leadership, global parent, debt-free.
- Weaknesses: Poor margins, volatile cash flows, absurd valuations.
- Opportunities: Industrial revival, government push for chemical sector.
- Threats: Competitors with better cost control, raw material price swings.
Final word? DNIL might eventually deliver, but at this price, the stock is wearing a “Kick Me” sign.
Written by EduInvesting Team | 30 July 2025
SEO Tags: DE Nora India, Electrochemical, Chlor-alkali, Stock Analysis


”")


