1. At a Glance
India’s contract electronics poster boy in defense and aerospace is now fumbling its circuits. Revenues are zipping, but profits? Not so much. With margins compressed, FII exits, and a P/E of 58+, Cyient DLM needs more than a wiring fix.
2. Introduction with Hook
Imagine buying a Ferrari, and then realizing it has the horsepower of a Nano. That’s what investors are feeling with Cyient DLM right now.
- Stock down ~37% from peak despite 84% YoY sales jump
- Q1 FY26 net profit crashed 29.6% QoQ, worst in 5 quarters
- ROE: just 7.33%, and it’s trading at 4x Book Value
Was the IPO hype just high-frequency noise?
3. Business Model (WTF Do They Even Do?)
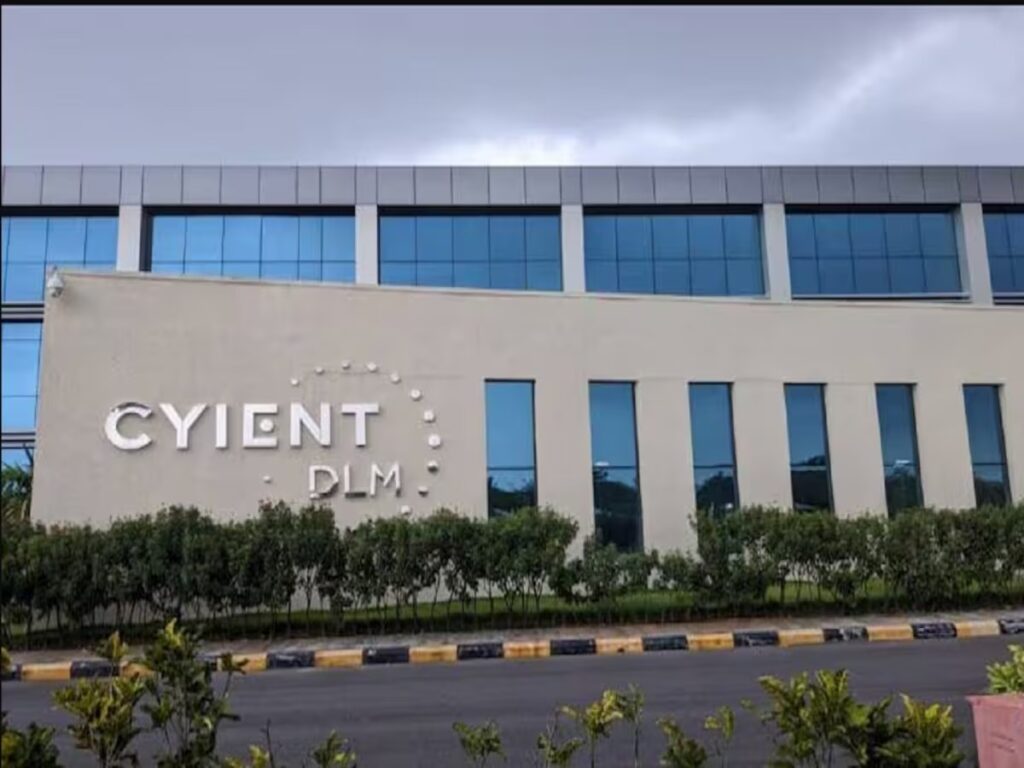
Cyient DLM = Electronics contract manufacturer + defense focus + LVHM = “Low Volume, High Mix” manufacturer of highly customized, critical electronics.
- Works with OEMs across defense, aerospace, medical, and high-reliability sectors
- Offers design, prototyping, manufacturing, testing & certification
- Revenue visibility via 3–5 year Master Service Agreements (MSAs)
- Client geos: India, North America, Europe, China, Japan
This is not your classic “run the mill PCB printer” — these guys wire missiles and Mars rovers.
4. Financials Overview
Q1 FY26 Highlights:
| Metric | Q1 FY26 | QoQ % | YoY % |
|---|---|---|---|
| Revenue | ₹278.4 Cr | -35.0% | +28.2% |
| EBITDA | ₹25.06 Cr | -56.3% | +25.4% |
| Net Profit | ₹7.46 Cr | -29.6% | +39.2% |
| EBITDA Margin | 9.0% | ↓ | ↓ |
| PAT Margin | 2.7% | ↓ | ↑ |
But here’s the kicker: despite a ₹1,540 Cr TTM revenue, cash from operations is negative for 2 consecutive years. More on that below.
5. Valuation
Current Price: ₹481
P/E (TTM): 58.7
Book Value: ₹120 → P/B = 4.02
EduVal™ Fair Value Estimate:
| Valuation Method | FV Estimate (₹) |
|---|---|
| DCF (10% growth) | 300–360 |
| EV/EBITDA (20x) | 340–400 |
| Peer Avg P/E (40x) | 330–390 |
Fair Value Range: ₹330–390
Current price is still ahead of its fundamentals. Valuation is screaming “You’re paying for future dreams… not current delivery.”
6. What’s Cooking – News, Triggers, Drama
- Massive DII Entry: DIIs ramped up stake from 12.5% → 28.2% in one year
- FII Flight: Down from 7% to 2.5% over the same period
- Promoter stake dip: From 66.6% to 52.1% — likely due to OFS post-IPO
- New MD/CEO Incoming: Fresh leadership on the cards
- Postal ballot announced: Likely governance shakeup
Investor trust issues? Or just tech-bro reshuffling?
7. Balance Sheet
| Metric | FY23 | FY24 | FY25 |
|---|---|---|---|
| Equity Capital | ₹53 Cr | ₹79 Cr | ₹79 Cr |
| Reserves | ₹145 Cr | ₹830 Cr | ₹870 Cr |
| Borrowings | ₹356 Cr | ₹192 Cr | ₹301 Cr |
| Total Assets | ₹1,105 Cr | ₹1,603 Cr | ₹1,694 Cr |
Key Points:
- IPO money fattened reserves big-time in FY24
- Borrowings rising again → ₹301 Cr in FY25
- Asset base expanded due to capacity addition + working capital
8. Cash Flow – Sab Number Game Hai
| Metric | FY23 | FY24 | FY25 |
|---|---|---|---|
| CFO (Op. Cash Flow) | ₹54 Cr | ₹-71 Cr | ₹-62 Cr |
| CFI (Investments) | ₹-142 Cr | ₹-428 Cr | ₹127 Cr |
| CFF (Financing) | ₹72 Cr | ₹479 Cr | ₹-59 Cr |
| Net Cash Flow | ₹-16 Cr | ₹-19 Cr | ₹+5 Cr |
Key Points:
- Two years of negative operating cash = Red flag
- FY24 saw huge capex post IPO
- FY25 had a short breather with marginal net cash flow
9. Ratios – Sexy or Stressy?
| Ratio | FY23 | FY24 | FY25 |
|---|---|---|---|
| ROCE | — | 14% | 11% |
| ROE | 6.0% | 7.7% | 7.3% |
| Cash Conversion Cycle | 150 | 131 | 189 |
| Working Capital Days | 65 | 96 | 136 |
Takeaway:
- Efficiency eroding → CCC bloated to 189 days
- ROE < 8% = not enough to justify a 58x P/E
- Working capital cycle becoming a monster
10. P&L Breakdown – Show Me the Money
| FY (₹ Cr) | FY23 | FY24 | FY25 |
|---|---|---|---|
| Revenue | 832 | 1,192 | 1,520 |
| EBITDA | 88 | 111 | 137 |
| PAT | 32 | 61 | 68 |
| EBITDA Margin % | 11% | 9% | 9% |
| Net Profit Margin | 3.8% | 5.1% | 4.5% |
Conclusion:
Sales are flying, but margin runway is short. High cost-to-serve + employee intensity + delay in pricing resets = thin profitability.
11. Peer Comparison
| Company | CMP (₹) | P/E | Mkt Cap (Cr) | ROE % | OPM % | PAT Qtr (Cr) |
|---|---|---|---|---|---|---|
| Kaynes | 5,783 | 131.9 | 38,703 | 11.02 | 15.1 | ₹116.2 |
| Honeywell | 40,655 | 68.7 | 35,988 | 13.7 | 14.1 | ₹139.9 |
| Jyoti CNC | 1,057 | 74.5 | 24,048 | 21.2 | 27.0 | ₹108.9 |
| Syrma SGS | 710 | 73.5 | 12,603 | 10.2 | 8.5 | ₹65.4 |
| Cyient DLM | 481 | 58.7 | 3,813 | 7.3 | 9.2 | ₹7.46 |
Observation:
Cyient DLM is cheaper than peers only by price, not valuation. Most competitors are more profitable, better capitalized, and offer dividends.
12. Miscellaneous – Shareholding, Promoters
| Stakeholder | Sep ‘23 | Dec ‘23 | Mar ‘24 | Jun ‘25 |
|---|---|---|---|---|
| Promoters | 66.66% | 66.66% | 52.16% | 52.12% |
| FIIs | 6.23% | 6.32% | 2.38% | 2.48% |
| DIIs | 12.28% | 11.22% | 28.64% | 28.16% |
| Public | 14.82% | 15.8% | 16.81% | 17.23% |
- FII EXIT: Dropped from 7.04% to 2.48%
- DII LOVE: Jumped to 28% — mostly MF-backed
- Retail Onboard: 1.10 lakh shareholders
13. EduInvesting Verdict™
Cyient DLM is building high-grade tech for high-grade sectors — but it’s currently stuck in low-margin land. Operational leverage is weak, capex is weighing on cash flows, and investor exits raise eyebrows.
The company needs to:
- Fix margins
- Control working capital
- Justify its premium valuations
Until then, this remains a story of great expectations… and delayed delivery.
Metadata
Written by EduInvesting Team | July 23, 2025
Tags: Cyient DLM, Electronics Manufacturing, Defense, Contract Manufacturing, Smallcap, IPO Watch


