1. At a Glance
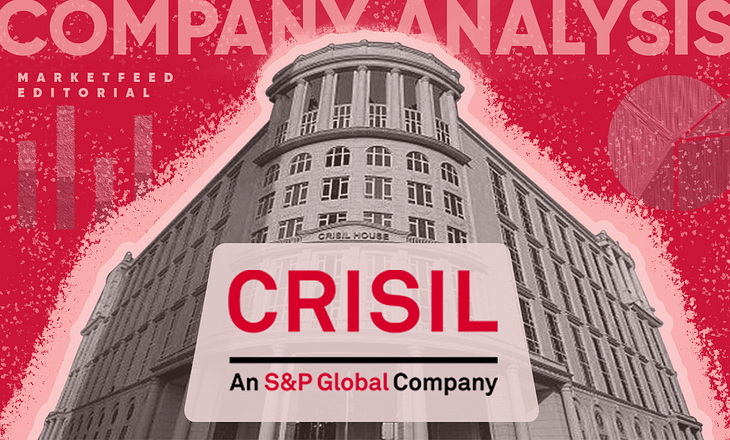
CRISIL is back with a ₹843 Cr revenue (+5.7%) and ₹172 Cr PAT (+8.2%) quarter. Declared ₹9/share dividend like clockwork. ROE and ROCE still making other companies jealous. But is its valuation still justified at 64x P/E?
2. Introduction with Hook
If S&P Global and SEBI had a baby in India, it’d be named CRISIL — born to rate, research, and rule.
- ₹732 Cr TTM PAT
- ₹636 Cr of that came from other income.
- ROE? 36.5%
- OPM? 15.5% — but looks better if you ignore the rating business’s skeleton crew.
CRISIL doesn’t make products. It makes opinions for money, and business is booming. But valuation? That’s where the irony begins.
3. Business Model (WTF Do They Even Do?)
CRISIL operates in 3 verticals:
- Ratings (28% of revenue)
- 51% of profits
- Margin machine
- Now housed under a separate subsidiary per SEBI norms
- Research (53% of revenue)
- Clients: global investment banks, asset managers
- Includes Coalition, which it’s now shutting down in Singapore (only 0.42% of revenue, so no milk was spilt)
- Advisory (19% of revenue)
- Public policy, infrastructure, risk analytics
- Not the star, but helps with diversification
CRISIL doesn’t just rate — it dictates how India’s risk is priced. Moody’s and S&P are global bosses; CRISIL runs the desi mafia.
4. Financials Overview
FY24 (vs FY23):
- Revenue: ₹1,628 Cr → ₹1,665 Cr
- PAT: ₹668 Cr → ₹616 Cr
- OPM: 21% → 15%
- Other Income: ₹493 Cr → ₹501 Cr → Now ₹636 Cr (TTM)
Q2 FY25:
- Revenue: ₹843 Cr (+5.7%)
- PAT: ₹172 Cr (+8.2%)
- EPS: ₹26.57
- Interim Dividend: ₹9/share
They’ve essentially outsourced EBITDA to their treasury income.
5. Valuation
Market Cap: ₹42,423 Cr
TTM PAT: ₹732 Cr
EPS (TTM): ₹100
P/E: 63.7x
Book Value: ₹244 → P/B: 23.8x
Fair Value Range Estimate:
| Method | Assumption | FV Estimate |
|---|---|---|
| PE 40x (Rich) | ₹732 Cr PAT | ₹29,280 Cr → ₹4,870/share |
| PE 50x (Very Rich) | ₹732 Cr PAT | ₹36,600 Cr → ₹6,090/share |
| DCF (Moderate Growth, Low Capex) | 12% WACC | ₹5,200–₹5,600/share |
At ₹5,800, it’s at the upper end. Great business, but you’re paying upfront for decades of clean reputation.
6. What’s Cooking – News, Triggers, Drama
Recent Moves:
- Closing down Coalition Singapore
- Interim dividend of ₹9/share
- Other income booming (likely from S&P investments or debt papers)
Triggers:
- More credit penetration = more SME ratings
- Increase in ESG/regulatory disclosures = more advisory wins
- Growing outsourced research demand from global IBs
Risks:
- High dependence on financial sector health
- Over-reliance on “other income” → ~87% of PAT comes from it
- Competition from CARE/ICRA slowly heating up again
7. Balance Sheet
| Metric (₹ Cr) | FY22 | FY23 | FY24 |
|---|---|---|---|
| Equity Capital | 7 | 7 | 7 |
| Reserves | 1,063 | 1,483 | 1,779 |
| Borrowings | 72 | 31 | 227 |
| Investments | 666 | 995 | 1,263 |
| Total Assets | 1,612 | 2,044 | 2,603 |
Key Notes:
- Debt negligible → mostly working capital
- Investment portfolio ballooning — again, where other income is born
- Treasury is now the real growth engine
8. Cash Flow – Sab Number Game Hai
| ₹ Cr | FY22 | FY23 | FY24 |
|---|---|---|---|
| Operating Cash Flow | 189 | 281 | 320 |
| Investing Cash Flow | 125 | 148 | 103 |
| Financing Cash Flow | -355 | -397 | -435 |
| Net Cash Flow | -41 | 32 | -12 |
Takeaway:
Payout-heavy company → sends most of its cash back to investors via dividends. Respect.
9. Ratios – Sexy or Stressy?
| Metric | FY23 | FY24 | TTM |
|---|---|---|---|
| ROCE | 56% | 39% | 39% |
| ROE | 36.5% | 37% | 36.5% |
| Debtor Days | 84 | 62 | 62 |
| OPM | 21% | 15% | 15% |
| Working Capital Days | 33 | -9 | -9 |
Verdict:
Return ratios = mint condition. But falling OPM needs watching — is it cyclical or structural?
10. P&L Breakdown – Show Me the Money
| ₹ Cr | FY22 | FY23 | FY24 |
|---|---|---|---|
| Revenue | 1,444 | 1,628 | 1,665 |
| EBITDA | 242 | 340 | 251 |
| EBITDA Margin % | 17% | 21% | 15% |
| PAT | 371 | 668 | 616 |
| PAT Margin % | 26% | 41% | 37% |
CRISIL doesn’t need much to grow. It’s like Infosys but with less code and more Excel sheets.
11. Peer Comparison
| Company | P/E | ROCE | ROE | OPM | CMP/BV |
|---|---|---|---|---|---|
| CRISIL | 63.7 | 39% | 36.5% | 15% | 23.8 |
| ICRA | 32.6 | 23% | 17% | 30% | 6.4 |
| CARE Ratings | 30.9 | 30% | 21% | 38% | 5.3 |
Conclusion:
CRISIL is the most trusted. But you pay a “halo premium” for it.
12. Miscellaneous – Shareholding, Promoters
| Category | Dec 22 | Mar 24 | Jun 25 |
|---|---|---|---|
| Promoters (S&P) | 66.7% | 66.6% | 66.6% |
| FIIs | 6.7% | 7.2% | 8.1% |
| DIIs | 13.0% | 12.9% | 12.0% |
| Public | 13.6% | 13.2% | 13.2% |
Key Notes:
- No promoter drama — S&P Global is THE boss
- FIIs slowly increasing stake
- Retail shareholder base growing → 68K holders now
13. EduInvesting Verdict™
CRISIL is a low-risk, high-reputation cash cow that doesn’t need to do much to justify its seat. But if you strip away the treasury returns, core business is growing modestly at best.
- Rating monopoly? Yes.
- Operating leverage? Slowing.
- Over-reliance on other income? Absolutely.
Verdict:
CRISIL is like that Ivy League kid who always tops the class — but you’re wondering if they’ll ever build a unicorn or just stay a glorified academic.
Metadata
– Written by EduInvesting Team | 22 July 2025
– Tags: CRISIL, Ratings, Research, S&P Global, Dividend Stocks, Q2 FY25, EduInvesting Premium

