1. At a Glance
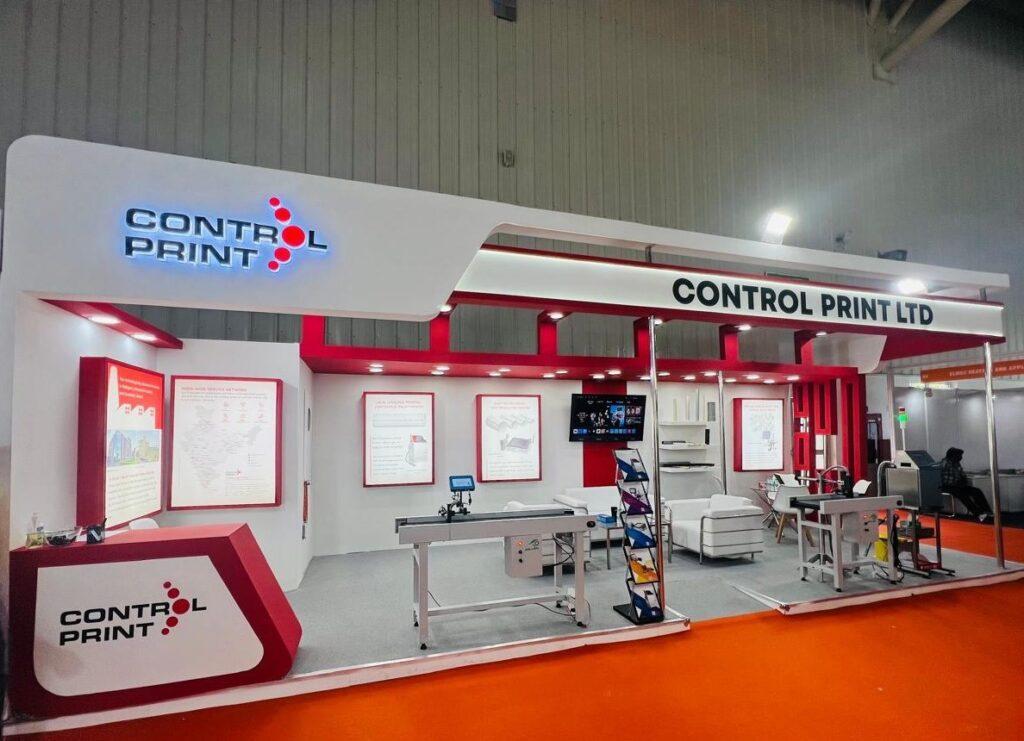
Control Print Ltd makes industrial printers, inks, and masks (yes, you read that right). It’s the only Indian manufacturer in the coding & marking space. Strong balance sheet, high promoter holding, and a quirky combo of products—but is it printing profits or errors?
2. Introduction with Hook
Imagine if a laser printer went to IIT, married a face mask, and got listed on BSE. That’s Control Print for you.
- Installed base: 21,000+ printers.
- Q1 FY26 net profit: ₹8.56 Cr (down 43% YoY)
- Operating margins: Slipping like ink on glossy paper—from 27% to 16.7% in one year.
3. Business Model (WTF Do They Even Do?)
Control Print operates in:
- Coding & Marking Machines: Used to print expiry dates, batch numbers on FMCG, pharma, and more.
- Consumables: Inks, solvents, spares = recurring revenue.
- Maintenance Services: AMCs and on-demand support.
- Face Masks: Entered during COVID, continues to milk the segment.
Its moat? Local manufacturing in a segment dominated by imports (Domino, Videojet).
4. Financials Overview
5-Year Snapshot (₹ Cr)
| FY | Revenue | EBITDA | Net Profit | OPM % | EPS (₹) |
|---|---|---|---|---|---|
| FY21 | 204 | 50 | 29 | 24% | 17.79 |
| FY22 | 256 | 59 | 40 | 23% | 24.55 |
| FY23 | 304 | 76 | 53 | 25% | 32.36 |
| FY24 | 359 | 86 | 54 | 24% | 33.95 |
| FY25 | 425 | 80 | 100 | 19% | 62.55 |
⚠️ Q1 FY26 hit by margin pressure. FY25 was a one-off boost from govt. grant income in Q4.
5. Valuation
Let’s decode the fair value range:
- TTM EPS: ₹60.81
- Industry P/E (Hardware peers): ~20
- Control Print P/E: ~13.3
FV Range
- Bear Case: ₹60 x 12 = ₹720
- Bull Case: ₹60 x 18 = ₹1,080
→ Fair Value Range: ₹720–₹1,080
At CMP ₹793, the market’s giving it a modest “you’re doing okay” hug.
6. What’s Cooking – News, Triggers, Drama
- Govt Grants: Accounted in Q4 FY25, boosted PAT temporarily.
- Mask Biz Drag: Once COVID-fueled, now just… meh.
- Q1FY26 Concall: Scheduled July 22. Street expects answers on margin erosion.
- Shareholder Shift: FII & DII holding falling, public shareholding rising = retail bhakt army taking over.
7. Balance Sheet
| Particulars | FY23 | FY24 | FY25 |
|---|---|---|---|
| Equity Capital | 16 | 16 | 16 |
| Reserves | 278 | 318 | 397 |
| Borrowings | 6 | 7 | 8 |
| Cash & Inv. | 100+ | 90+ | ~95 |
| Total Assets | 374 | 434 | 508 |
Key Points
- Debt? Barely noticeable.
- Fixed assets increasing = capacity ramp-up?
- Reserves looking like a gym bro—bulking well.
8. Cash Flow – Sab Number Game Hai
| Year | CFO | CFI | CFF | Net |
|---|---|---|---|---|
| FY23 | ₹55 Cr | ₹-36 Cr | ₹-17 Cr | ₹1 Cr |
| FY24 | ₹50 Cr | ₹8 Cr | ₹-51 Cr | ₹7 Cr |
| FY25 | ₹50 Cr | ₹-37 Cr | ₹-19 Cr | ₹-7 Cr |
Observation
- Strong operating cash flows.
- Capex is steady.
- Dividends + buybacks > inflows.
9. Ratios – Sexy or Stressy?
| Ratio | FY23 | FY24 | FY25 |
|---|---|---|---|
| ROE | 22% | 27% | 27% |
| ROCE | 23% | 24% | 18% |
| OPM | 25% | 24% | 19% |
| EPS | 32.36 | 33.95 | 62.55 |
| D/E | 0.02 | 0.02 | 0.02 |
Verdict: Margins slipping but still juicy. Returns? Still outperforming Sensex love stories.
10. P&L Breakdown – Show Me the Money
| Year | Revenue | EBITDA | PAT | EPS | OPM% |
|---|---|---|---|---|---|
| FY22 | ₹256 Cr | ₹59 Cr | ₹40 Cr | ₹24.5 | 23% |
| FY23 | ₹304 Cr | ₹76 Cr | ₹53 Cr | ₹32.3 | 25% |
| FY24 | ₹359 Cr | ₹86 Cr | ₹54 Cr | ₹33.9 | 24% |
| FY25 | ₹425 Cr | ₹80 Cr | ₹100 Cr | ₹62.5 | 19% |
Q1FY26 EPS = ₹5.35 = weak start. Blame lower OPM and fewer govt freebies.
11. Peer Comparison
| Company | CMP | P/E | ROCE | OPM | Sales (₹ Cr) | PAT (₹ Cr) |
|---|---|---|---|---|---|---|
| D-Link | 523 | 19.1 | 28% | 9.2% | 1,384 | 97 |
| Rashi Periph | 311 | 9.9 | 14% | 2.2% | 13,773 | 206 |
| Moschip | 169 | 96.9 | 11% | 12% | 467 | 33 |
| Control Print | 793 | 13.3 | 18.5% | 18% | 438 | 97 |
Insight: Lower scale than peers, but higher profitability and consistent margins = niche player strength.
12. Miscellaneous – Shareholding, Promoters
- Promoters: 52.99%
- FIIs: 3.3% (downtrend)
- DIIs: 0.68% (vanishing)
- Public: 43% (rising)
Narrative: Institutions are ghosting. Retail junta is swiping right.
13. EduInvesting Verdict™
Control Print is not your average IT-hardware stock—it’s the quirky uncle who prints codes on shampoo bottles while secretly running a mask factory. The financials are solid, margins under pressure, and the Q1 FY26 was a letdown.
But the fundamentals? Still debt-free, dividend-paying, and profitable. If you’re into moats, margin games, and manufacturing stories that don’t scream “tech bubble,” Control Print deserves a place on your radar.
Whether it inks a re-rating or fades like cheap toner—only time (and the next concall) will tell.
Metadata
– Written by EduInvesting Team | 21 July 2025
– Tags: Control Print, Industrial Printers, Coding & Marking, Q1FY26, Earnings Analysis, Smallcap Stocks


