General information and entertainment, not investment advice. The author is not a SEBI-registered adviser or research analyst. No recommendation, no promised returns. Markets carry risk including loss of capital. Figures may not be current. Consult a registered adviser before acting.
1 — At a Glance
The financial narrative for Cello World Ltd in FY26 reflects a distinct divergence between top-line expansion and bottom-line optimization. Annual revenue rose to ₹2,323.71 crore in FY26, up from ₹2,136.39 crore in FY25. Despite this growth, annual net profit contracted slightly from ₹338.82 crore to ₹331.51 crore over the same period.
Operational constraints presented persistent headwinds throughout the year. Glassware utilization levels hovered at 60% due to aggressive import dumping from China, while a strategic shift from Chinese imports to domestic original equipment manufacturers (OEMs) compressed hydration margins by 5% to 6%. On the positive side, Q4 FY26 delivered record quarterly revenue of ₹653.59 crore, driven by a 64% year-on-year surge in the writing instruments segment.
[FY25 Revenue: ₹2,136.39 Cr] —> +8.8% —> [FY26 Revenue: ₹2,323.71 Cr]
[FY25 Net Profit: ₹338.82 Cr] —> -2.2% —> [FY26 Net Profit: ₹331.51 Cr]
Balance sheet liquidity metrics signals clear inefficiencies, as working capital days expanded significantly from 184 days to 279 days. A growing top-line provides minimal comfort when structural supply transitions and underutilized production lines strain near-term profitability. The analysis turns next to how these moving parts fit into the broader operational reset.
2 — Introduction
Cello World Ltd operates as an established participant in the Indian consumer products market, maintaining a presence across multiple consumer categories. The company’s operational footprint spans consumer houseware, writing instruments and stationery, alongside molded furniture and allied items. This structural diversification is designed to capture varied consumer spending points across household lifecycles.
A major structural reorganization concluded recently with the merger of Wim Plast Ltd into Cello World Ltd, effective May 27, 2026, with an appointed date of April 1, 2025. This corporate consolidation seeks to streamline regulatory compliance and integrate overlapping manufacturing and distribution frameworks.
The market has priced in these operational transitions through a prolonged correction. The stock delivered a 1-year return of -37.4%, reflecting near-term caution regarding margin compression and competitive pressures. Prices referenced in this analysis are not live, utilizing a lagged reference price of ₹382.1 per share. This valuation context serves as the baseline for evaluating the company’s asset efficiency and category performance.
3 — Business Model: WTF Do They Even Do?
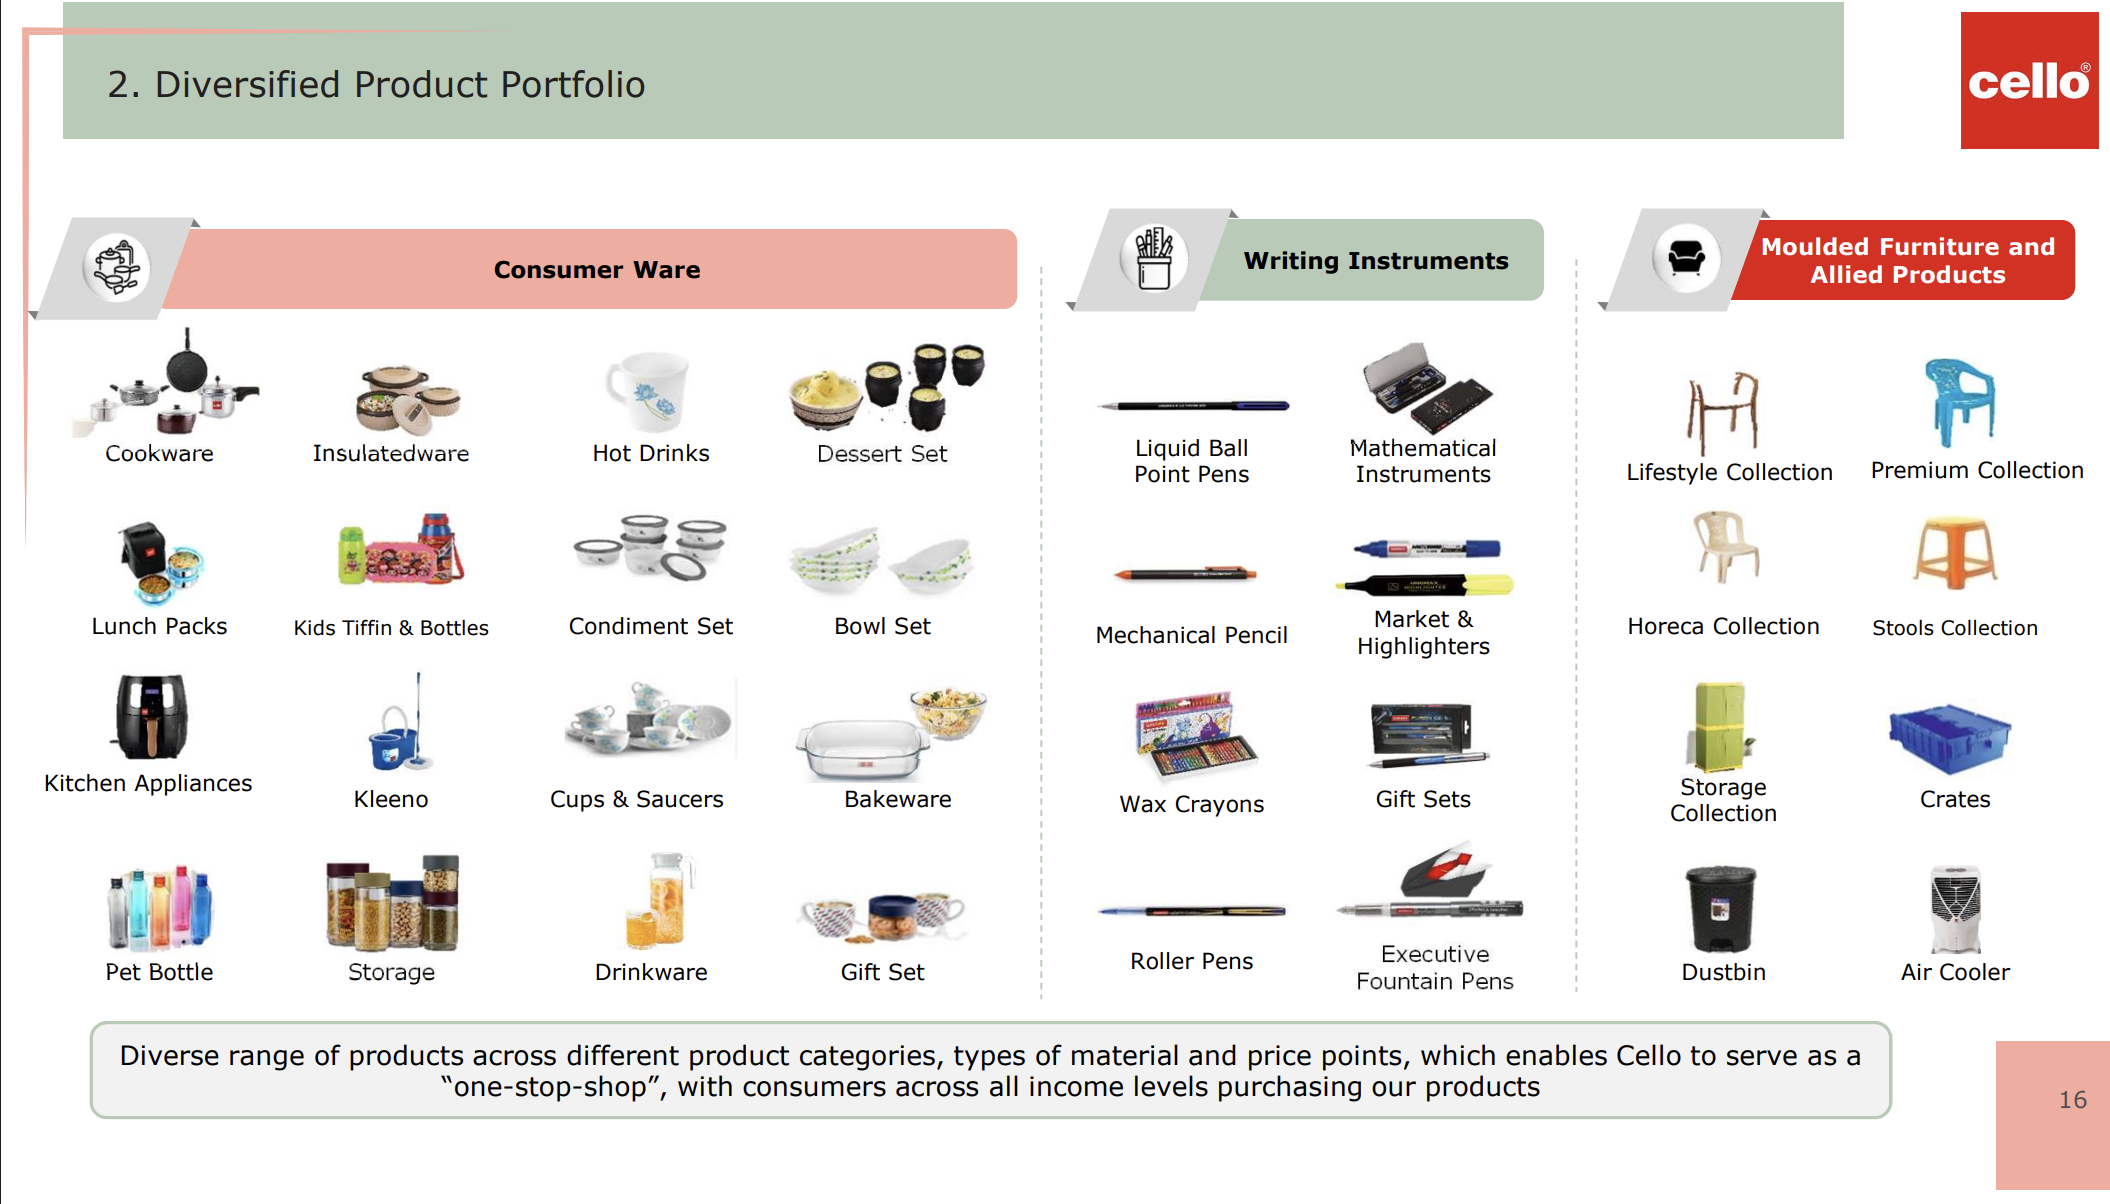
The company effectively manufactures and distributes the plastic, glass, and steel material culture of the Indian middle-class household. Its corporate architecture relies on three primary segments: Consumer Houseware, Moulded Furniture & Allied Products, and Writing Instruments
H1 FY26 Revenue Breakdown:
── Consumer Houseware: 70.5%
── Moulded Furniture & Allied Products: 15.6%
── Writing Instruments: 13.9%
The consumer houseware business represents the largest chunk, driven by brands like Maxfresh, Puro, and Duro. The company recently committed ₹250 crore to an in-house glassware facility in Falna, Rajasthan. However, the plant operates at a modest ~60% utilization rate, constrained by low-cost Chinese imports that have kept the segment near financial breakeven.
The writing instruments division operates via the Unomax brand and was recently augmented by a zero-royalty lease agreement with the promoter group to regain the use of the legacy “Cello” trademark. While this segment expanded rapidly in Q4 FY26, the integration acts as an immediate drag because the acquired stationery operations were structurally loss-making prior to absorption.
A unique characteristic of the model is that the listed entity does not own its core trademarks. The brands Cello, Unomax, Kleeno, and Puro remain registered under a private promoter partnership firm, Cello Plastic Industrial Works. The business essentially leases its brand identity from its founders. Furthermore, a legacy litigation initiated in 2017 by competitor BIC Clichy alleging non-compete violations continues to sit unresolved before the Bombay High Court.
4 — Financials Overview
“Figures are consolidated, in ₹ crore.”
Quarterly Performance Table
| Metric | Latest Q (Mar 2026) | YoY (Mar 2025) | QoQ (Dec 2025) |
| Revenue | 653.59 | 588.82 | 553.66 |
| EBITDA | 136.56 | 148.21 | 114.85 |
| PAT | 90.12 | 88.19 | 63.64 |
| Reported EPS (₹) | 4.08 | 3.99 | 2.88 |
Note: EBITDA is calculated using the formula EBITDA = PBT + Interest + Depreciation based on the data sheet entries.
Earnings Call Context
Management characterized the period as a sequence of operational adjustments. The highest-ever quarterly revenue in Q4 was driven primarily by the writing instruments segment, which benefited from the formal introduction of the Cello stationery portfolio.
However, gross margins experienced compression due to higher domestic sourcing costs for steel flasks, alongside localized energy inflation impacting the glassware division. Tighter distributor management and product pruning are underway to correct the expanding working capital cycle.
5 — Valuation Discussion: Fair Value Range (Educational Only)
What follows is a walkthrough of how three valuation methods work, using this company’s numbers as the example — not a target, not a forecast, not advice.
- Method 1 (P/E): This model multiplies the annualised earnings per share by the prevailing peer multiple range to determine a baseline equity value.Implied Value Range = Annualised EPS × Peer P/E BandMethod 1 (P/E): annualised EPS ₹15.01 × peer band 22.25–37.94x produces ₹333.97–₹569.48.
- Method 2 (EV/EBITDA): This approach evaluates enterprise value relative to operating cash generation, adjusting for net cash or debt positions before dividing by total shares.Implied Equity Value = ((EBITDA × EV/EBITDA Range) – Net Debt)/(Outstanding Shares)Method 2 (EV/EBITDA): annualised EBITDA ₹518.96 Cr × peer band 12x–20x produces ₹286.15–₹473.91.
- Method 3 (Simplified DCF): This mathematical convention applies a sustainable long-term growth expectation against an estimated equity discount rate.Value = (EPS × (1 + g))/(r – g)Method 3 (Simplified DCF): annualised EPS ₹15.01 × growth factor metrics produces ₹300.20–₹500.33.
These figures show how the methods work and are not a valuation, a target, or advice.
6 — What’s Cooking
- Merger Finalization: NCLT Ahmedabad sanctioned the composite scheme of arrangement involving Wim Plast Ltd and Cello Consumer Products on May 14, 2026, with the merger becoming fully effective on May 27, 2026.
- Capital Infusion: Management converted ₹500 crore of internal corporate loans into equity and executed a fresh ₹100 crore cash infusion into Cello Consumer Products Private Ltd to support balance sheet realignment.
- Aggressive Pricing Actions: The company implemented widespread maximum retail price (MRP) increases ranging between 12% and 20% across all primary consumer lines to combat persistent input material inflation.
- Trademark Reclamation: A zero-royalty agreement was signed with the promoter group to secure the long-term usage rights of the “Cello” trademark specifically for the stationery and writing business.
- Regulatory GST Dispute: GST authorities issued an Order-in-Original contesting the historical tax classification of polyurethane bottles and lunchboxes under HSN 7323 instead of HSN 3923 for the periods spanning 2018 to 2025.
- Industrial Incident: A furnace fire occurred at the Cello Industries facility on February 18, 2025, forcing temporary manufacturing pauses, though zero casualties were reported.
7 — Balance Sheet
Balance Sheet Summary Table
| Item | Mar 2024 | Mar 2025 | Mar 2026 |
| Total Assets | 1,969.70 | 2,640.09 | 3,003.18 |
| Net Worth | 1,149.22 | 2,167.40 | 2,700.95 |
| Borrowings | 370.71 | 5.29 | 38.11 |
| Other Liabilities | 449.77 | 467.40 | 264.12 |
| Total Liabilities | 1,969.70 | 2,640.09 | 3,003.18 |
Balance Sheet Observations
- Formal borrowings dropped sharply to ₹5.29 crore in 2025 only to creep back up to ₹38.11 crore in 2026, proving that absolute debt freedom is highly dynamic when capacity expansions roll through.
- Other Assets expanded significantly to ₹1,607.15 crore by March 2026, indicating a large volume of capital tied up outside immediate fixed blocks.
- Cash and Bank balances improved to ₹127.77 crore, offering an internal liquidity buffer as operational working capital cycles stretch out.
Clean leverage ratios offer limited solace when working capital absorbs capital faster than distribution collections can replenish it. Net cash positions sit at ₹89.66 crore based on ₹127.77 crore in liquid cash against ₹38.11 crore in aggregate borrowings.
8 — Cash Flow: Sab Number Game Hai
Three-Year Cash Flow Trends
| Year | Operating Cash Flow (CFO) | Investing Cash Flow (CFI) | Financing Cash Flow (CFF) |
| Mar 2024 | 231.18 | -255.63 | 26.01 |
| Mar 2025 | 261.73 | -553.43 | 311.22 |
| Mar 2026 | 255.06 | -175.67 | -4.71 |
The cash flow trajectory highlights the capital-heavy phase the company went through. In FY25, an extensive investing cash outflow of -₹553.43 crore significantly outpaced the operating cash intake of ₹261.73 crore, requiring a net financing inflow of ₹311.22 crore to balance the ledger.
By March 2026, investing activity moderated down to -₹175.67 crore, allowing the business to self-sustain its operations without taking on external capital. A corporate structure can absorb brief earnings growth plateaus, but it cannot withstand a prolonged mismatch between multi-hundred crore fixed asset creation and actual cash collection at the counter.
9 — Ratios: Sexy or Stressy?
- ROE 13.8% — The company’s internal equity engine is turning at a slower pace compared to its historic three-year average of 21%.
- ROCE 17.4% — The capital employed yields modest returns as new investments in glassware and steel manufacturing lines undergo gradual optimization.
- P/E 25.46x — The market values the trailing earnings stream at a multiple that assumes a prompt stabilization of operating margins.
- PAT Margin 14.27% — This net profitability metric reflects the combined dilutive pressure of Chinese dumping and elevated domestic outsourcing costs.
- D/E 0.01 — The leverage ratio confirms that the balance sheet remains clear of formal debt burdens.
10 — P&L Breakdown: Show Me the Money
Three-Year Income Statement Trends
| Year | Revenue | EBITDA | PAT |
| Mar 2024 | 2,000.26 | 534.30 | 331.06 |
| Mar 2025 | 2,136.39 | 554.74 | 338.82 |
| Mar 2026 | 2,323.71 | 518.96 | 331.51 |
Note: EBITDA is extracted via the standard operating framework (EBITDA = PBT + Interest + Depreciation).
The core top-line demonstrates steady volume execution, moving from ₹2,000.26 crore to ₹2,323.71 crore over a three-year arc. However, operating EBITDA reversed in FY26, contracting to ₹518.96 crore from ₹554.74 crore due to rising raw material input costs and integration friction. Net profit followed a similar flat trajectory, settling at ₹331.51 crore as annual depreciation expenses expanded to ₹77.73 crore.
Does an 8.8% top-line growth rate justify an expanding asset base when core operating profits are moving backward?
11 — Peer Comparison
Peer Operational Metric Table
| Company | Revenue | PAT | P/E |
| Cello World | 2,323.71 | 331.51 | 25.46x |
| Hawkins Cookers | 1,252.93 | 131.19 | 30.61x |
| Borosil | 1,195.92 | 77.65 | 34.11x |
| All Time Plastic | 610.42 | 38.83 | 37.94x |
Cello World commands a revenue scale nearly double that of Borosil, yet the market applies a higher P/E multiple of 34.11x to Borosil’s earnings stream. Similarly, Hawkins Cookers maintains an ROCE of 40.89% on roughly half of Cello’s revenue base, highlighting why different capital efficiency profiles command varied premiums from the market. All Time Plastic operates at a smaller scale of ₹610.42 crore but trades at 37.94x, indicating that the market values smaller, focused product niches differently than broad consumer portfolios.
12 — Miscellaneous: Shareholding & Promoters
Shareholding Allocation Table
| Holder | Percentage (%) |
| Promoters | 75.00% |
| Institutions | 18.25% |
| Public | 6.74% |
Promoters maintain a tight 75.00% ownership threshold, keeping their personal capital locked into the company’s long-term operational outcome. The core leadership team, composed of Pradeep, Pankaj, and Gaurav Rathod, retains absolute voting control.
While institutional investors hold 18.25%, public retail shareholders represent just 6.74% of the float. The family structures operations so that public capital participates in the manufacturing profits, while the underlying trademark assets remain held within their private partnership firm.
13 — Corporate Governance: Angels or Devils?
Corporate governance records indicate zero promoter equity pledges, mitigating risk from forced market liquidations. However, compliance reports from May 29, 2026, noted delayed historical disclosures regarding certain related-party transactions from FY24, which incurred minor penalty fines of ₹5,000 each from the NSE and BSE.
The ongoing litigation with BIC Clichy regarding the 2009 non-compete clauses represents a long-standing legal detail before the Bombay High Court. Conversely, the zero-royalty structure negotiated for the Cello stationery brand indicates a favorable alignment of interest between the promoter group and the listed shareholders.
14 — Industry Roast & Macro Context
The consumer houseware and writing instruments sector is a challenging arena where corporate brands contest the minor margins of plastic lunchboxes and everyday gel pens. Listed players are forced to absorb the volatile pricing cycles of underlying polymer raw materials while dealing with Chinese factories that periodically dump low-priced glassware into domestic channels.
Distribution economics are also undergoing a structural shift. Traditional retail networks face pressure from the rapid, asset-light expansion of quick commerce and e-commerce platforms, which now account for 17% of joint revenue streams. This is a sector where a company must continuously deploy capital and innovate just to preserve its existing market share.
15 — EduInvesting Verdict
SWOT Matrix
| Strengths | Weaknesses |
| • Strong promoter ownership at 75% • Low debt profile with D/E at 0.01 | • Key brands owned by promoter partnership firm • Working capital stretched to 279 days |
| Opportunities | Threats |
| • Import substitution via new steel lines • Stationery division target of ₹500 cr+ | • Persistent Chinese dumping in glassware • Raw material input cost volatility |
A distribution network with undeniable depth, alongside an operational engine with everything to prove during a domestic manufacturing transition.
