1. At a Glance
Despite a tough Q2 CY25, CIE Automotive clocked ₹204 Cr in profit and kept margins stable at 14%. Yes, the growth engine may have hit a small speed bump, but the balance sheet’s still rock solid — and debt almost nil.
2. Introduction with Hook
Think of CIE Automotive like a European-engineered diesel SUV — reliable, torquey, globally integrated… but not always speedy.
- Q2 PAT: ₹204 Cr (YoY down ~6%)
- Sales: ₹2,369 Cr (YoY up 2%)
- Margins: Consistent 14% OPM
- Debt: Practically nonexistent
- Global Exposure: From Pune to Pamplona and Mexico to Mangaluru
It’s Mahindra’s global forging cannon — even if the bullets lately have been slower.
3. Business Model (WTF Do They Even Do?)
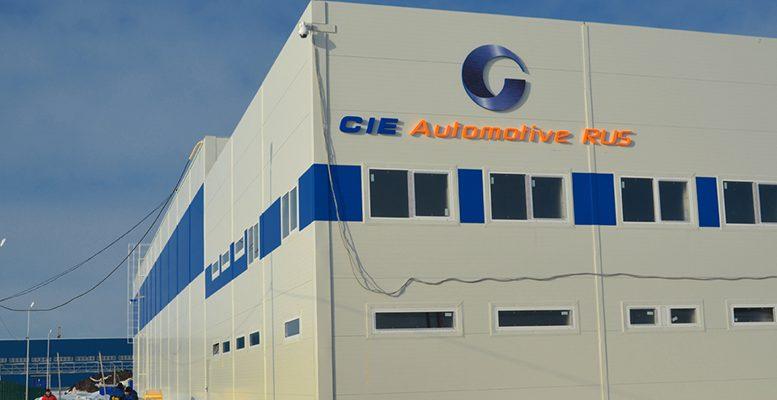
CIE Automotive India is the Indian arm of Spain’s CIE Automotive S.A., and they’ve got one job: Make world-class forged, machined, cast, and plastic auto parts and ship ’em to every auto OEM worth mentioning.
Product lines include:
- Forgings (their bread & butter)
- Castings, Machining, Composites, Gears
- For Passenger Vehicles, CVs, Tractors, and EVs
Key Clientele: Mahindra, Tata, Maruti, VW, Daimler, and more
Footprint: India, Germany, Spain, Lithuania, Mexico
Bottom line? If it moves, CIE probably built a part of it.
4. Financials Overview
| Metric | Q2 CY24 | Q2 CY25 | YoY Change |
|---|---|---|---|
| Revenue | ₹2,320 Cr | ₹2,369 Cr | +2% |
| EBITDA | ₹370 Cr | ₹337 Cr | -9% |
| EBITDA Margin | 16% | 14% | -200bps |
| Net Profit | ₹217 Cr | ₹204 Cr | -6% |
| EPS | ₹5.72 | ₹5.37 | -6.1% |
Verdict?
Flat revenue + Margin compression = Profit slowdown. Not a disaster, just a sleepy quarter.
5. Valuation
- CMP: ₹429
- TTM EPS: ₹20.84
- P/E: ~20.6x
- Book Value: ₹173
- P/B: ~2.47x
- Dividend Yield: 1.63%
Fair Value Range:
| Method | FV Range (₹) |
|---|---|
| P/E (18x–22x) | ₹375 – ₹460 |
| P/B (2.2x–2.8x) | ₹380 – ₹485 |
| EV/EBITDA Multiple (10x) | ₹410 – ₹465 |
Conclusion: Near upper range of FV, not overpriced, not deep value — riding the midline.
6. What’s Cooking – News, Triggers, Drama
- Debt-Free Status: Net debt now negligible (₹570 Cr debt vs ₹6,197 Cr reserves)
- Forging Biz in Europe Sluggish: Eurozone slowdown hurting volumes
- India Margin Stability: India operations = consistent OPM
- Credit Ratings: [ICRA]AA (Stable) reaffirmed
- Promoter Holding Drop: Down 9% in 3 years. Why? PE exit or reshuffle?
Not much masala, but definitely a few slow-burn triggers.
7. Balance Sheet
| FY End (₹ Cr) | CY22 | CY23 | CY24 (TTM) |
|---|---|---|---|
| Equity Capital | ₹379 | ₹379 | ₹379 |
| Reserves | ₹4,719 | ₹5,609 | ₹6,197 |
| Borrowings | ₹985 | ₹855 | ₹570 |
| Fixed Assets | ₹5,547 | ₹5,810 | ₹5,857 |
| Total Assets | ₹9,920 | ₹9,753 | ₹9,749 |
Summary:
- Net Worth: ₹6,576 Cr → solid cushion
- Debt Reduction = recurring interest savings
- Capex mostly done — no wild expansion spree ahead
8. Cash Flow – Sab Number Game Hai
| Year | CFO | CFI | CFF | Net Cash Flow |
|---|---|---|---|---|
| CY22 | ₹1,118 Cr | ₹-637 Cr | ₹-488 Cr | ₹-6 Cr |
| CY23 | ₹1,383 Cr | ₹-905 Cr | ₹-427 Cr | ₹51 Cr |
| CY24 (TTM) | ₹881 Cr | ₹-237 Cr | ₹-553 Cr | ₹91 Cr |
Healthy operating cash → Capex-funded internally → Debt being paid → Shareholder-friendly
9. Ratios – Sexy or Stressy?
| Metric | CY22 | CY23 | TTM |
|---|---|---|---|
| ROCE | 15% | 18% | 17% |
| ROE | 10% | 13% | 13% |
| OPM | 13% | 15% | 15% |
| NPM | ~4.5% | ~12.1% | 9.1% |
| Cash Conv. | -35 | -32 | -13 |
Verdict: Efficient ops, tight working capital, good capital allocation. But ROCE needs to stay >18% for market rerating.
10. P&L Breakdown – Show Me the Money
| Year | Revenue | EBITDA | PAT | EPS |
|---|---|---|---|---|
| CY22 | ₹8,753 Cr | ₹1,172 Cr | ₹-136 Cr | ₹-3.59 |
| CY23 | ₹9,280 Cr | ₹1,424 Cr | ₹1,125 Cr | ₹29.66 |
| CY24 | ₹8,964 Cr | ₹1,351 Cr | ₹828 Cr | ₹21.81 |
| TTM | ₹8,886 Cr | ₹1,302 Cr | ₹790 Cr | ₹20.84 |
CY22 = Extraordinary Loss Year (one-off charges). CY23 was a comeback, CY24 stabilizing.
11. Peer Comparison
| Company | P/E | ROCE | OPM | Sales (Cr) | PAT (Cr) | MCap (Cr) |
|---|---|---|---|---|---|---|
| Bosch | 56x | 21% | 12.8% | ₹18,087 | ₹2,012 | ₹1.13L Cr |
| Uno Minda | 66x | 18.8% | 11.2% | ₹16,775 | ₹934 | ₹61,945 Cr |
| Bharat Forge | 63x | 12% | 17.8% | ₹15,122 | ₹923 | ₹58,360 Cr |
| Endurance Tech | 47x | 17% | 13.4% | ₹11,561 | ₹782 | ₹36,959 Cr |
| CIE Automotive | 20.8x | 16.6% | 14.6% | ₹8,886 | ₹782 | ₹16,269 Cr |
Conclusion?
CIE offers best value for money on every ratio except pizzazz.
12. Miscellaneous – Shareholding, Promoters
| Category | Jun 2023 | Jun 2025 |
|---|---|---|
| Promoters | 74.96% | 65.70% |
| FIIs | 7.54% | 4.15% |
| DIIs | 14.75% | 21.48% |
| Public | 11.96% | 8.61% |
Key Points:
- DIIs love it. FIIs? Not so much anymore.
- Public shareholding shrinking = quiet accumulation by funds?
13. EduInvesting Verdict™
CIE Automotive is the quiet global compounder most investors forget exists. Solid RoCE, zero debt, growing cash flows, and European backing. But lack of sizzle means… it trades like a Maruti in a Tesla world.
Pros:
✅ Debt free
✅ Strong margins
✅ Global customer base
✅ Efficient capex + CFO generation
Cons:
❌ Flat topline growth
❌ Promoter stake reduction
❌ Underwhelming short-term excitement
Verdict: A mid-cap mechanical powerhouse. Not sexy, not hyped — just solid. And sometimes, that’s enough.
Metadata
– Written by EduInvesting Team | 21 July 2025
– Tags: CIE Automotive India, Q2 CY25 Results, Auto Components, Forging, Mahindra Group, European Subsidiary, Debt-Free Stock


