At a Glance
Chemplast Sanmar is back in the headlines, but not for the reasons investors would put on a mug. Q1 FY26 delivered ₹1,100 crore in revenue, EBITDA of just ₹17 crore, and a net loss of ₹64 crore. Anti-dumping investigations are on, capacity expansions are crawling, and investors are still waiting for the “speciality” in speciality chemicals. Stock trades at ₹431, hugging its 52-week low, and return ratios are in the red. In short, it’s a PVC party where the DJ never showed up.
1. Introduction
Remember that cool kid who relisted in 2021 at a market cap of ₹8,553 crore with big dreams? Fast forward to FY26, and Chemplast Sanmar is now trading at a market cap of ₹6,813 crore—down but not out. The company, part of the Sanmar Group, has been battling multiple storms: weak demand, pricing pressure, and a cocktail of losses.
Quarter after quarter, the company’s results have been like a bad sitcom—predictable yet painful. Investors now wonder if this is the turnaround season or just another filler episode.
2. Business Model (WTF Do They Even Do?)
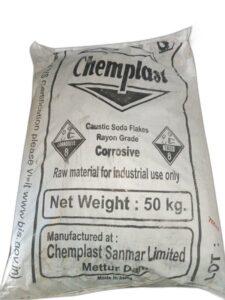
Chemplast Sanmar manufactures speciality chemicals, including specialty paste PVC resin, custom chemicals for pharma and agro sectors, caustic soda, and chlorochemicals. These are not your average backyard bleach products—they cater to industries that demand high-quality chemicals. The company also produces hydrogen peroxide, refrigerant gas, and industrial salt.
Plants are spread across Tamil Nadu and Puducherry, ensuring logistics headaches are minimal. But here’s the twist: despite producing essential chemicals, profitability is elusive, and operational leverage is about as helpful as an umbrella in a hurricane.
3. Financials Overview
- Revenue (Q1 FY26): ₹1,100 crore (flat YoY)
- EBITDA: ₹17 crore (margin a hilarious 2%)
- Net Loss: ₹64 crore (vs loss of ₹31 crore Q1 FY25)
- ROE: -5.93% (screaming red)
- ROCE: 1.83% (barely breathing)
Commentary:
EBITDA margin has become the Bermuda Triangle—profits enter but never return. Despite ₹4,301 crore annual sales (TTM), profits are negative. Other income props up numbers occasionally, but high interest and depreciation costs eat away any hope.
4. Valuation
Chemplast trades at 3.29x book value with no P/E because, well, there’s no “E”. Using the crystal ball of valuation:
- P/E Method: NA (loss-making)
- EV/EBITDA: Assuming EV ≈ ₹8,600 Cr and EBITDA ≈ ₹200 Cr → EV/EBITDA ≈ 43x (ouch)
- DCF: Based on optimistic future cash flows, fair value ranges ₹300–₹350.
Fair Value Range: ₹300–₹350 (Investors may prefer yoga mats for stress relief).
5. What’s Cooking – News, Triggers, Drama
- Anti-dumping probes: May push PVC prices higher if duties imposed.
- Capacity expansions: Delays continue; will they ever be margin accretive?
- Market demand: Weak domestic demand adds to woes.
6. Balance Sheet
| Particulars (₹ Cr) | FY23 | FY24 | FY25 |
|---|---|---|---|
| Assets | 5,837 | 6,030 | 6,503 |
| Liabilities | 5,837 | 6,030 | 6,503 |
| Net Worth | 1,858 | 1,701 | 2,068 |
| Borrowings | 1,019 | 1,548 | 1,842 |
Remarks: Debt is climbing faster than profits; net worth is fragile. Auditors probably keep antacids handy.
7. Cash Flow – Sab Number Game Hai
| (₹ Cr) | FY23 | FY24 | FY25 |
|---|---|---|---|
| Operating Cash | 355 | -245 | 172 |
| Investing Cash | -217 | -524 | -407 |
| Financing Cash | -27 | 382 | 66 |
Remarks: Operating cash flow is erratic. FY24 saw negative OCF, proving cash is as moody as the stock price.
8. Ratios – Sexy or Stressy?
| Ratio | Value |
|---|---|
| ROE | -5.93% |
| ROCE | 1.83% |
| P/E | NA |
| PAT Margin | -5% |
| D/E | 0.9 |
Remarks: Ratios scream stress; only the D/E ratio is tolerable.
9. P&L Breakdown – Show Me the Money
| (₹ Cr) | FY23 | FY24 | FY25 |
|---|---|---|---|
| Revenue | 4,941 | 3,923 | 4,346 |
| EBITDA | 468 | 21 | 219 |
| PAT | 152 | -158 | -110 |
Remarks: From ₹468 Cr EBITDA in FY23 to ₹21 Cr in FY24, this is a financial rollercoaster with no seatbelts.
10. Peer Comparison
| Company | Revenue (₹ Cr) | PAT (₹ Cr) | P/E |
|---|---|---|---|
| SRF | 15,048 | 1,431 | 63 |
| Tata Chem | 14,817 | 461 | 52 |
| Deepak Fert. | 10,274 | 934 | 21 |
| GNFC | 7,892 | 597 | 13 |
| Chemplast | 4,301 | -198 | NA |
Remarks: Chemplast is the only one flaunting negative profits—peer group is laughing quietly.
11. Miscellaneous – Shareholding, Promoters
- Promoter Holding: 54.99% (unchanged, they’re loyal or trapped)
- FII Holding: 13.33% (slowly increasing)
- Public Holding: 6.02% (retail mostly holding bags)
Promoters are Sanmar Group, with decades of chemical experience. No big M&A or IPO drama lately.
12. EduInvesting Verdict™
Chemplast Sanmar is a case study in how even speciality chemicals can have a very unspecial financial journey. The company has scale, products, and a legacy, but profitability is missing. High debt, low margins, and inconsistent cash flows paint a bleak short-term picture.
On the flip side, anti-dumping duties and demand recovery could rescue margins. Capacity expansion, if managed well, could deliver a turnaround by FY27. Investors with patience (and nerves of steel) may hold on, while traders might look elsewhere.
For now, Chemplast is a high-risk, long-term “maybe”—like buying a lottery ticket where the jackpot is just your capital back.
Written by EduInvesting Team | 29 July 2025
SEO Tags: Chemplast Sanmar, Q1 FY26 Results, Speciality Chemicals, PVC Resin, Stock Analysis
