🧠 At a Glance
CEAT Ltd, RPG Group’s tyre titan, has doubled profits in 3 years and expanded margins to 11%. But with ROE still at ~12%, negative other income, and a P/E of 31, the stock’s 44% YoY rally raises eyebrows. Is this a traction king or just pumped-up rubber?
1. 🎯 Introduction with Hook
CEAT has gone from flat to fast.
Once considered the “budget tyre brand,” CEAT is now outperforming even premium rivals in profit growth. Its stock has zoomed 50% in 3 years, with ROCE back at 15%, margins at multi-year highs, and market cap crossing ₹15,000 Cr.
But there’s also a bit of skidding:
- FII holding is down
- Other income is shockingly negative
- Tyresnmore acquisition still feels more buzzwordy than profitable
So are investors getting a smooth ride or just rolling on hype?
2. 🏭 WTF Do They Even Do?
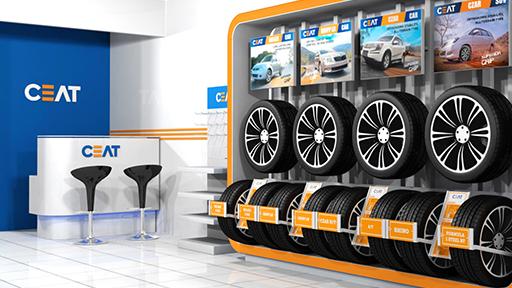
CEAT manufactures all kinds of tyres for:
- 2-Wheelers
- Passenger Vehicles
- Trucks, Buses, Off-Road Equipment
- Exports to 100+ countries
It operates 6 manufacturing plants, 3 R&D facilities, and is increasingly betting on:
- 📦 Digital distribution via Tyresnmore.com
- 🏍️ Premium motorcycle and EV tyres
- 🧑🏭 OEM partnerships with top auto brands
Legacy meets lean startup. Or tries to.
3. 📊 Financials Overview – Profit, Margins, ROE, Growth
| Metric | FY21 | FY22 | FY23 | FY24 | FY25 |
|---|---|---|---|---|---|
| Revenue (₹ Cr) | 7,610 | 9,363 | 11,315 | 11,943 | 13,218 |
| EBITDA (₹ Cr) | 993 | 721 | 974 | 1,653 | 1,474 |
| Net Profit (₹ Cr) | 432 | 71 | 182 | 635 | 471 |
| EPS (₹) | 106.8 | 17.6 | 46.0 | 158.9 | 116.9 |
| ROE (%) | 14% | 2% | 5% | 16% | 12% |
📈 3Y Net Profit CAGR = 80%
📉 TTM profit has dipped 27%
🧾 Margins are now sustainable ~11%
4. 📉 Valuation – Is It Cheap, Meh, or Crack?
- P/E: 31.2 → Slightly above tyre sector median (25–28)
- P/B: 3.54 → High for a cyclical player
- EV/EBITDA: ~11x → Fair to mild premium
- Dividend Yield: 0.79%
📌 Fair Value Estimation (FY26E)
Assume EPS of ₹135 (10% growth over FY25)
- At 20x = ₹2,700
- At 25x = ₹3,375
➡️ Edu FV Range = ₹2,700 to ₹3,400
CMP ₹3,818 → riding ahead of fundamentals
5. 🍿 What’s Cooking – News, Triggers, Drama
- 🧾 Q1FY26 Results on July 18, 2025
- 🛞 Invested ₹3.55 Cr in Tyresnmore subsidiary
- 👋 Resignation of NED Paras Chowdhary
- 🏭 Capacity expansion ongoing in Nagpur
- 📉 Other income hit due to FX and mark-to-market losses
While operationally solid, the CFO and market may not love that “other income -₹33 Cr” line.
6. 💰 Balance Sheet – How Much Debt, How Many Dreams?
| Year | Debt (₹ Cr) | Reserves (₹ Cr) | Total Liabilities (₹ Cr) |
|---|---|---|---|
| FY21 | 1,533 | 3,276 | 8,133 |
| FY23 | 2,295 | 3,399 | 9,627 |
| FY25 | 2,136 | 4,328 | 11,212 |
📉 Borrowings peaked in FY23, slightly down now
📈 Net debt still over ₹2,000 Cr
⚠️ Not alarming, but keep an eye on capex burn + WC
7. 💵 Cash Flow – Sab Number Game Hai
| FY | CFO (₹ Cr) | CFI (₹ Cr) | CFF (₹ Cr) | Net Cash Flow |
|---|---|---|---|---|
| 2023 | ₹1,205 | -849 | -320 | ₹37 |
| 2024 | ₹1,719 | -854 | -871 | -₹5 |
| 2025 | ₹1,092 | -922 | -177 | -₹7 |
💸 Operating cash flow fell 36% in FY25
🏭 Capex remains elevated
🧾 Negative net cash again → decent liquidity, but tight rope
8. 📐 Ratios – Sexy or Stressy?
| Metric | FY23 | FY24 | FY25 |
|---|---|---|---|
| ROCE % | 9% | 20% | 15% |
| ROE % | 5% | 16% | 12% |
| OPM % | 9% | 14% | 11% |
| CCC (Days) | -14 | -23 | -13 |
| Inventory Days | 56 | 61 | 63 |
| Debtor Days | 42 | 39 | 46 |
✅ Working capital is efficient (negative CCC)
✅ ROCE improved despite macro headwinds
🚨 Slight deterioration in margins and working capital
9. 📊 P&L Breakdown – Show Me the Money
FY25 Snapshot:
- Revenue: ₹13,218 Cr
- EBITDA: ₹1,474 Cr
- EBITDA Margin: 11.2%
- PBT: ₹622 Cr
- PAT: ₹471 Cr
- EPS: ₹116.85
A robust year—down from peak but higher than pre-FY24 averages.
10. 🤼 Peer Comparison – Who Else in the Game?
| Company | P/E | ROE % | OPM % | MCap (₹ Cr) |
|---|---|---|---|---|
| MRF | 32.9 | 10.6 | 14.5 | ₹61,500 |
| BKT | 33.4 | 15.8 | 23.5 | ₹50,700 |
| Apollo Tyres | 24.1 | 8.7 | 13.7 | ₹29,900 |
| CEAT | 31.2 | 11.7 | 11.1 | ₹15,400 |
| JK Tyre | 19.7 | 11.1 | 10.9 | ₹10,200 |
➡️ CEAT is middle of the pack: cheaper than MRF, more expensive than Apollo, solid performance.
11. 📌 Miscellaneous – Shareholding, Promoters, etc.
- Promoter Holding: Steady at 47.2%
- FII Holding: Falling → 26% → 15.3%
- DII Holding: Rising → now 21.5%
- Retail Holding: ~16%
- Shareholders: Jumped from 91K to 1.57 lakh in 2 years
📊 DIIs love it, FIIs not so much
📉 Watch for further shifts in July 18 results
12. 👨⚖️ EduInvesting Verdict™
CEAT has found the perfect tyre-pressure zone — not too hot like MRF, not too deflated like JK.
📈 Margins? Back.
📉 Other income? Worrying.
📊 Valuation? Not frothy, not cheap.
It’s a well-rounded player, but at ₹3,800+, it’s priced like it’ll never hit a pothole again.
Fair Value (FY26E): ₹2,700–₹3,400
CMP: ₹3,818 → a bit of air in the tyre, but it’s not bursting yet.
✍️ Written by Prashant | 📅 09 July 2025
Tags: CEAT Ltd, Tyre Stocks, RPG Group, Tyresnmore, Auto Components, Apollo Tyres, MRF, EduInvesting
