1. At a Glance
An SME casting company with ₹92 Cr in FY25 sales, a 43% 3Y profit CAGR, and a P/E that’s higher than your Uber surge pricing at 2 AM. But ROCE is rock-solid at 30%, and cash flows are forging ahead. Captain’s not just making alloys—it’s alloying growth with margin.
2. Introduction with Hook
Imagine a foundry so efficient, it casts both molten steel and shareholder dreams at the same time. That’s Captain Technocast, the Rajkot-based metal-melter making superalloy castings for global industries—while casually growing PAT by 109% YoY and throwing a 1:1 bonus just for fun.
- FY25 Net Profit: ₹8.4 Cr (up 117% from FY24)
- 5Y Profit CAGR: 36%
- ROE: 25%
- Market Cap: ₹641 Cr on ₹92 Cr sales. Multiples? More like multiverse.
3. Business Model (WTF Do They Even Do?)
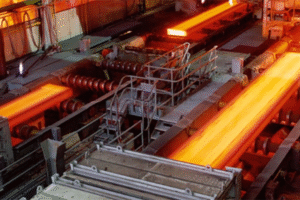
Captain Technocast makes investment castings—complex, high-precision parts made by pouring molten metal into wax molds.
Product Portfolio:
- Carbon steel, alloy steel, non-ferrous & superalloy components
- Used in valves, pumps, defense, auto, railways, and energy sectors
Core Competence:
- Ability to do small-batch precision casting
- High-mix, low-volume capability—ideal for niche industrial parts
- Diversifying into forward integration via subsidiaries (X2 Valves, Captain Polyplast linkage)
Key Revenue Sources:
- Domestic B2B sales
- Exports to niche industrial clients
4. Financials Overview
| Year | Revenue (₹ Cr) | EBITDA (₹ Cr) | PAT (₹ Cr) | OPM (%) | PAT Margin (%) |
|---|---|---|---|---|---|
| FY21 | 42.6 | 3.6 | 2.3 | 8.4% | 5.4% |
| FY22 | 50.5 | 5.3 | 2.8 | 10.5% | 5.6% |
| FY23 | 59.1 | 5.7 | 2.9 | 9.7% | 4.9% |
| FY24 | 64.2 | 6.4 | 3.9 | 10.0% | 6.0% |
| FY25 | 92.2 | 11.7 | 8.4 | 12.7% | 9.1% |
Key Highlights:
- Explosive growth in FY25, PAT doubled
- Margins are improving consistently
- No dividend, but reinvestment is clearly working
5. Valuation
a) P/E Based
- EPS FY25: ₹3.47
- P/E range (for high-growth SMEs in manufacturing): 30x–50x
→ FV = ₹104 to ₹174
Current P/E = 79.6 → FV Premium = Spicy
b) EV/EBITDA
- FY25 EBITDA = ₹11.7 Cr
- Apply EV/EBITDA range of 20x–25x → EV = ₹234–₹293 Cr
- Net Debt = ₹4.47 Cr → Equity = ₹229–₹288 Cr
- Shares = 11.61 Cr → FV/share = ₹197–₹248
Conclusion: CMP ₹276 is on the hotter end. Fully priced for perfection. One wobble = derating risk.
6. What’s Cooking – News, Triggers, Drama
- 1:1 Bonus Issue (April 2025) – Market cap doubled; liquidity zoomed
- Acquisition of Subsidiary – Bought stake in X2 Valves Pvt Ltd
- Convertible Warrants Drama – Multiple preferential allotments + ₹8.4 Cr infusion
- Promoter Holding Drop – Down from 73.5% to 64.7% → dilution alert
- Cash Flows – ₹9.93 Cr from ops in FY25, highest ever
7. Balance Sheet
| Item | FY20 | FY21 | FY22 | FY23 | FY24 | FY25 |
|---|---|---|---|---|---|---|
| Equity Capital | 10.2 | 10.2 | 10.2 | 10.2 | 10.2 | 11.6 |
| Reserves | 2.5 | 4.8 | 7.2 | 9.9 | 13.7 | 28.8 |
| Borrowings | 4.2 | 9.7 | 8.4 | 9.6 | 8.5 | 4.5 |
| Total Assets | 25.9 | 37.2 | 40.8 | 44.4 | 43.9 | 62.5 |
Takeaway:
- Leverage cut from ₹9.6 Cr to ₹4.5 Cr → huge positive
- Reserves 2x’d in FY25 = retained earnings + capital raise
8. Cash Flow – Sab Number Game Hai
| Year | CFO (₹ Cr) | CFI (₹ Cr) | CFF (₹ Cr) | Net Cash Flow |
|---|---|---|---|---|
| FY23 | ₹3.26 | ₹-2.91 | ₹0.17 | ₹0.52 |
| FY24 | ₹6.88 | ₹-5.09 | ₹-2.25 | ₹-0.47 |
| FY25 | ₹9.93 | ₹-13.77 | ₹3.78 | ₹-0.06 |
Conclusion:
- Operating cash healthy
- Aggressive investing (subsidiary, plant capex)
- Net cash flat despite expansion = balanced execution
9. Ratios – Sexy or Stressy?
| Metric | FY22 | FY23 | FY24 | FY25 |
|---|---|---|---|---|
| ROCE (%) | 17.1% | 17.9% | 19.3% | 30.0% |
| ROE (%) | 13.5% | 14.3% | 18.6% | 25.0% |
| Debtor Days | 137.6 | 131.4 | 82.2 | 67.5 |
| Inventory Days | 99.9 | 72.9 | 87.1 | 82.2 |
| CCC | 89.3 | 95.2 | 83.6 | 49.2 |
Verdict:
- Working capital cycle tightened = very bullish
- ROCE + ROE breakout = stock re-rating justified
10. P&L Breakdown – Show Me the Money
| Year | Sales (₹ Cr) | EBITDA (₹ Cr) | OPM (%) | PAT (₹ Cr) | EPS (₹) |
|---|---|---|---|---|---|
| FY23 | 59.1 | 5.7 | 9.7% | 2.9 | 1.43 |
| FY24 | 64.2 | 6.4 | 10.0% | 3.9 | 1.89 |
| FY25 | 92.2 | 11.7 | 12.7% | 8.4 | 3.47 |
Explosive. That’s not earnings, that’s a controlled detonation.
11. Peer Comparison
| Company | Sales (₹ Cr) | PAT (₹ Cr) | ROCE (%) | P/E | OPM (%) |
|---|---|---|---|---|---|
| Kaynes Tech | 2,721.8 | 293.4 | 14.4% | 136 | 15.1% |
| Jyoti CNC | 1,817.7 | 322.8 | 24.4% | 71 | 27.0% |
| Syrma SGS | 3,787.2 | 171.4 | 12.4% | 70 | 8.5% |
| Captain Technocast | 92.2 | 8.4 | 30.0% | 79 | 12.7% |
Conclusion:
Valuation-wise, Captain is pricing itself like a large-cap disrupter. But margins and returns back it up—for now.
12. Miscellaneous – Shareholding, Promoters
| Category | Mar ’24 | Apr ’25 |
|---|---|---|
| Promoters | 73.55% | 64.69% |
| Public | 26.45% | 35.32% |
| Shareholders | 348 | 505 |
Flags & Fireworks:
- Promoter holding dropped sharply post preferential issue
- Retail participation rising fast → liquidity surge
- Big rise in equity capital due to bonuses & warrants
13. EduInvesting Verdict™
Captain Technocast Ltd is proof that you don’t need to be a unicorn to be unstoppable. It’s a classic SME juggernaut: cash-rich, margin-strong, and capital-efficient. Yes, P/E is scary and promoter dilution deserves monitoring—but with operating cash flows, ROCE, and PAT all sprinting ahead, this captain clearly has its hands on the growth wheel.
Verdict:
Forged in fire, cooled in cash. Just keep an eye on dilution drama.
Metadata
– Written by EduInvesting Research Team | July 13, 2025
– Tags: Captain Technocast, Precision Castings, SME Metals, Rajkot Foundry, Bonus Share SME, High ROCE Stocks, Investment Castings

