General information and entertainment, not investment advice. The author is not a SEBI-registered adviser or research analyst. No recommendation, no promised returns. Markets carry risk including loss of capital. Figures may not be current. Consult a registered adviser before acting.
1. At a Glance
Here is a company that did something rare in FY26: it grew revenue, kept profit almost perfectly flat, and let its operating margin fall anyway. Sales rose to ₹105.05 Cr from ₹99.73 Cr. Net profit landed at ₹25.5 Cr, a whisker below FY25’s ₹25.8 Cr. And operating margin, which sat at 35% two years ago, came in at 24%.
The cash tells its own story. CapitalNumbers holds roughly ₹170 Cr in cash and investments against zero borrowings — a pile equal to about 72% of its ₹235 Cr market cap. Some of that pile is now committed: on 3 July 2026 the company signed an agreement to buy a US Salesforce consultancy for about ₹40 Cr.
Two numbers refuse to sit still, though. Working capital days went from 49 to 328. Debtor days climbed from 24 to 36. For a debt-free services firm swimming in liquidity, that is an odd pair of readings to leave on the table.
The market pays 9.2x earnings here against a peer median of 20.6x. Whether that gap is the collateral of a margin still sliding, or of an IPO-flush balance sheet the market hasn’t priced, is the tension this entry lays out.
2. Introduction
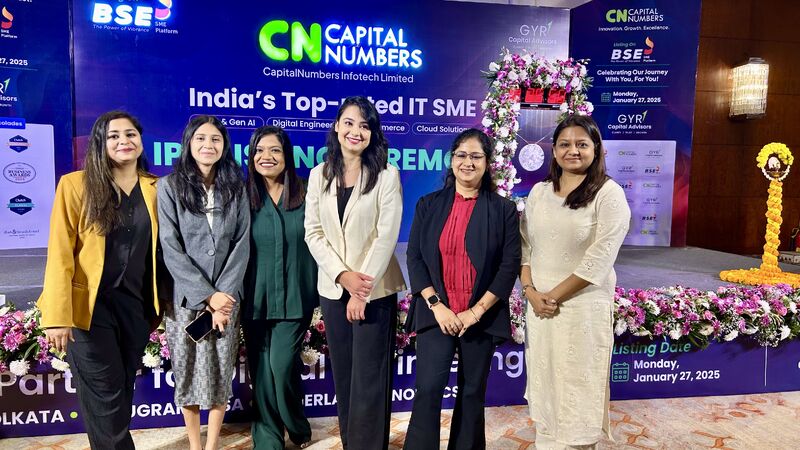
CapitalNumbers Infotech was incorporated in 2012 in Kolkata and listed on the BSE SME platform on 27 January 2025, raising ₹169 Cr in the process. The business is digital engineering: software development, cloud, data, and — increasingly — AI, delivered to global enterprises and startups. Revenue is export-led, with the US, Europe/UK, India, and the Middle East all featuring in the FY26 mix.
The year under review was the company’s first full year as a listed entity, and it reads like one. IPO proceeds sat on the balance sheet as current investments and fixed deposits. A second development center in Gurgaon was ramped. Senior hires were brought in. Sales and marketing spend went up. All of this landed in the P&L before the corresponding revenue did — which is the entire shape of FY26.
Since March, the company has been busy on the announcements front: a ₹2.46 Cr AI healthcare order in June, and the ₹40 Cr Epitome Cloud acquisition that moved from board authorisation in May to signed agreement in July. The founding Gupta family still holds close to 75%.
3. Business Model: WTF Do They Even Do?
They rent out engineers, mostly. About 91% of FY26 revenue came from Time & Material engagements — clients pay for hours and integration rather than a fixed deliverable — with the remaining 9% fixed-price. It is a model that trades the margin upside of productised software for the visibility of billing by the clock.

The service menu is long: cloud engineering, data engineering and analytics, AI/ML and generative AI, UI/UX, blockchain, AR/VR, web and mobile, QA, and custom software. The AI line is the one management keeps pointing at, and for once the pointing is backed by a number — AI-related work crossed 10% of total revenue for the first time in FY26.
Geographically it is an export shop end to end. The US led at 41% of FY26 revenue, Europe/UK at 31%, then Middle East 11%, India 10%, and the rest 7%. The Middle East is the interesting entry: it went from a growth bet to home of a top-five client, and then to a place where, per the concall, the company deliberately stopped sending travelling teams amid regional instability. A geography that is simultaneously a top client and a no-fly zone is a genuinely unusual line item.
Does a services firm billing 91% by the hour ever escape the trap of growth requiring bodies? That question sits under everything that follows.
4. Financials Overview
Figures are consolidated, in ₹ crore. The reporting cadence is half-yearly; the latest period is H2 FY26 (ended March 2026).
| Metric | Latest Half (H2 FY26) | YoY (H2 FY25) | Prev Half (H1 FY26) |
|---|---|---|---|
| Revenue | 52.4 | 49.5 | 52.7 |
| Operating Profit | 11 | 12 | 14 |
| PAT | 10.7 | 12.1 | 15.0 |
| EPS (₹) | 4.38 | 4.96 | 6.06 |
Revenue in the latest half grew 5.7% YoY but was essentially flat against the preceding half. Profit fell harder: PAT dropped 11.6% YoY, and the operating profit line slid from ₹14 Cr in H1 to ₹11 Cr in H2.
Per the concall: management stated the year came in “below our internal expectations,” attributing slower growth to elongated enterprise decision cycles and delayed ramp-ups, with some business shifting into FY27. On margins, management pointed to deliberate spend — global sales and marketing, the Gurgaon ramp, and senior hires — as the reason the operating line moderated even as investment continued. Management also guided to minimum 35% revenue growth in FY27, calling it “the most pessimistic projection.” That figure is management’s forecast, not a claim made here.
5. Market Expectations & Historical Multiples
This section describes how the market is currently pricing the company and how that compares with its own history and peer group. It is descriptive, not predictive.
| Metric | Current | Historical Average | Peer Median |
|---|---|---|---|
| P/E | 9.2x | — | 20.6x |
| EV/EBITDA | 4.1x | — | — |
| P/B | 1.2x | — | — |
| ROE | 14.6% | 24.2% (5-yr) | — |
| ROCE | 19.6% | — | 22.2% |
The market currently pays 9.2x earnings here versus a peer median of 20.6x. The P/B of 1.2x sits close to book, which is itself unusual for a debt-free IT services firm. ROE at 14.6% runs well below its own 5-year average of 24.2% — a gap that follows directly from the enlarged equity base after the IPO, since a bigger denominator lowers the ratio even when profit holds.
What the market appears to be pricing in is a company mid-transition: margins that have compressed 900 bps over two years, a return profile diluted by fresh equity, and working capital that ballooned in FY26. Against that, it carries a cash-heavy balance sheet whose deployment (into the Epitome acquisition) is only now beginning. The multiple describes a market weighing a diluted, lower-margin present against an as-yet-unproven redeployment.
One factual observation on expectations: the peer set here is dominated by large-cap IT names carrying dividend yields, scale, and decades of history, which makes any single-multiple comparison a comparison across very different sizes.
6. What’s Cooking
Three events, all sourced to filings, all real.
First, the big one: on 3 July 2026 the company signed a stock purchase agreement to acquire 100% of Epitome Cloud Inc, a US-incorporated (2020) Salesforce and revenue-lifecycle consultancy with an Indian subsidiary, for about ₹40 Cr in cash. Per the disclosure, Epitome’s standalone turnover was $2.87M in CY2025 — down from $4.12M in CY2024. Funding is IPO proceeds plus internal accruals, no external debt.
Second: on 11 June the company secured a ₹2.46 Cr international AI healthcare order — a six-month T&M contract for an undisclosed UK entity.
Third: the board approved a 10% interim dividend and proposed a further 10% final dividend for FY26 — the company’s first dividend payout, after years at zero.
A ₹40 Cr acquisition of a target whose revenue shrank in its most recent year is a spicy line. Management framed it, per the concall, as buying US onshore presence and premium Salesforce specialisation rather than buying growth — and called it the first of “two-three more” planned acquisitions.
7. Balance Sheet
| Item | FY24 | FY25 | FY26 |
|---|---|---|---|
| Total Assets | 72.9 | 164.1 | 199.6 |
| Net Worth | 67.4 | 156.9 | 191.6 |
| Borrowings | 0 | 0 | 0 |
| Other Liabilities | 5.5 | 7.2 | 8.0 |
| Total Liabilities | 72.9 | 164.1 | 199.6 |
Assets equal liabilities in every column, which is the least a balance sheet can do and this one does it.
- Net worth tripled across two years, almost entirely from the FY25 IPO — reserves jumped from ₹46 Cr to ₹132 Cr in a single year.
- Borrowings have read zero for three straight years; the interest coverage figure of 228x is what “almost no interest to cover” looks like as a ratio.
- Cash and bank of ₹88.62 Cr plus current investments of ₹81.13 Cr give roughly ₹170 Cr of liquidity against nothing owed — an acquisition war-chest that is only now being drawn on.
A balance sheet with ₹170 Cr and no debt has exactly one job: put the money to work before it becomes an excuse for a low return.
8. Cash Flow: Sab Number Game Hai
| Year | Operating | Investing | Financing |
|---|---|---|---|
| FY24 | 22.3 | -16.1 | -19.5 |
| FY25 | 19.2 | -76.6 | 63.6 |
| FY26 | 17.1 | -34.3 | 8.9 |
The operating line has drifted down three years running — ₹22.3 Cr to ₹17.1 Cr — even as revenue rose, which is where those swelling working-capital and debtor days show up in cash terms. FY25’s financing inflow of ₹63.6 Cr is the IPO landing. The large investing outflows in FY25 and FY26 are IPO proceeds being parked into liquid funds and deposits rather than spent on the business.
Operating cash that falls while sales rise is the balance sheet quietly telling you where the growth went: into receivables, not the bank.
9. Ratios: Sexy or Stressy?
| Ratio | Value |
|---|---|
| ROE | 14.6% |
| ROCE | 19.6% |
| P/E | 9.2x |
| PAT Margin | 24.3% |
| D/E | 0.00 |
ROE at 14.6% is the equity working at a fraction of its old pace — the 5-year average sat above 24%, and the drop traces to the enlarged post-IPO capital base rather than a collapse in profit. ROCE of 19.6% is respectable in absolute terms but sits below the peer median of 22.2%. PAT margin of 24.3% remains healthy, though the operating margin beneath it has done most of the falling. D/E of zero is the cleanest number in the table and has been for years.
10. P&L Breakdown: Show Me the Money
| Year | Revenue | Operating Profit | Other Income | PAT | EPS (₹) |
|---|---|---|---|---|---|
| FY24 | 98.2 | 34 | 2.5 | 26.1 | 12.32 |
| FY25 | 99.7 | 30 | 6.0 | 25.8 | 10.56 |
| FY26 | 105.0 | 25 | 10.6 | 25.5 | 10.44 |
The Other Income column is the one to watch. It went from ₹2.5 Cr to ₹10.6 Cr in two years — and now equals nearly a third of the ₹34.05 Cr profit-before-tax. That other income is largely deposit interest and gains on selling investments, which is what happens when you sit on ₹170 Cr. Meanwhile operating profit — the actual business — fell from ₹34 Cr to ₹25 Cr over the same stretch. Headline PAT looks flat only because a shrinking operating engine is being topped up by a growing treasury.
On EPS: it slipped from ₹12.32 to ₹10.44 even though PAT barely moved. That is share-count arithmetic, not a profit story — the count went from about 2.12 Cr shares (partial post-IPO) to 2.44 Cr on a full-year weighted basis. An EPS that falls while PAT holds is the IPO dilution showing up, nothing more.
11. Peer Comparison
| Company | Revenue (Qtr) | PAT (Qtr) | P/E |
|---|---|---|---|
| TCS | 70,698 | 13,784 | 14.2x |
| Infosys | 46,402 | 8,509 | 14.1x |
| Persistent Systems | 4,056 | 529 | 38.5x |
| CapitalNumbers | 52.4 | 10.7 | 9.2x |
| Peer Median (69 Co.) | 110 | 13.4 | 20.6x |
The size gap is the headline: CapitalNumbers’ full-quarter revenue of ₹52 Cr is a rounding error next to TCS’s ₹70,698 Cr. On multiple, it carries the lowest P/E in this group — under half the peer median — while running an ROCE below that median. The market is applying a small-cap, SME-platform discount to a firm whose margins and return ratios are mid-transition.
12. Miscellaneous: Shareholding & Promoters
| Holder | % |
|---|---|
| Promoters | 74.98 |
| Institutions (FII + DII) | 3.65 |
| Public | 21.37 |
The Gupta family holds the controlling block: Mukul Gupta (MD & CEO) at 40.40%, Herprit Gupta at 27.17%, and Vipul Gupta at 7.40%. Per the presentation, Mukul Gupta raised his stake from 39.80% to 40.40% through open-market purchases during FY26 — a promoter adding to a position rather than trimming it. FII holding thinned to 0.16% over the year while public holding rose to 21.37%. No shares are pledged.
13. Corporate Governance: Angels or Devils?
The statutory auditor, Satyanarayan Goyal & Co. LLP, issued an unmodified opinion on both standalone and consolidated FY26 results. There is one Emphasis of Matter, and it is worth stating plainly: in the prior year the company had debited gross IPO issue expenses — including the portion attributable to the Offer for Sale — against Securities Premium, rather than only the net expenses attributable to itself. This was corrected in FY26; the OFS-attributable amount was recovered from the selling shareholders on 24 November 2025, restoring the premium balance. The auditor’s opinion was not modified for this.
The board runs three promoter directors and three independent directors. Borrowings are zero, no shares are pledged, and the acquisition disclosure confirms Epitome is not a related-party transaction. The record here is clean, with the IPO-expense reclassification the one item filed openly and resolved.
14. Industry Roast & Macro Context
The IT services sector spent FY26 caught between two forces, both of which show up in this company’s numbers. On one side, enterprise clients stretched out their decision cycles — the reason management gave for revenue landing below plan, with deals now framed as taking six to twelve months to close. On the other, AI demand is real enough that a microcap crossed 10% AI revenue for the first time.
It is a sector where the big names bill by the tens of thousands of crores and the small ones fly to trade shows — nine of them in FY26, per the concall — to scrape together 500 qualified leads. The Middle East, briefly the sector’s growth darling, turned into a place teams stopped travelling to. Selling software engineering globally means your pipeline is only ever as stable as the least stable region you booked a booth in.
15. EduInvesting Verdict
| Strengths | Weaknesses |
|---|---|
| Zero debt; ~₹170 Cr cash & investments | Operating margin fell ~900 bps in two years |
| First dividend declared (10% + 10%) | Working capital days jumped 49 → 328 |
| AI revenue crossed 10% of total | Other income now ~⅓ of PBT |
| Clean, unmodified audit | ROE diluted from 24% avg to 14.6% |
| Opportunities | Threats |
|---|---|
| Epitome Cloud adds US onshore presence | Target’s revenue shrank in CY2025 |
| Stated pipeline of further acquisitions | Elongating enterprise decision cycles |
| Operating leverage from Gurgaon ramp | Middle East geopolitical caution |
CapitalNumbers closes FY26 as a study in mismatched trajectories: a treasury growing faster than the operations, a profit line held flat by interest income while the operating engine cooled, and a balance sheet finally being pointed at an acquisition after a year of sitting still. The record shows a debt-free, clean-audited services firm with everything it needs to redeploy — and a set of margin and working-capital lines that will decide whether the redeployment reads as growth or as expensive standing still. A company with nothing owed and everything to prove.