1. At a Glance
Old as Independence, this micro-cap from the Brady Group makes material handling equipment and doesn’t believe in dividends. But its profits are lifting like its cranes—quietly and sharply. With 35% profit CAGR, 25% ROCE, and a 100x jump in EPS in FY25, something heavy is moving here.
2. Introduction with Hook
If Warren Buffett met an Indian crane manufacturer, he might say, “Compounding ka asli ustaad toh yeh hai.”
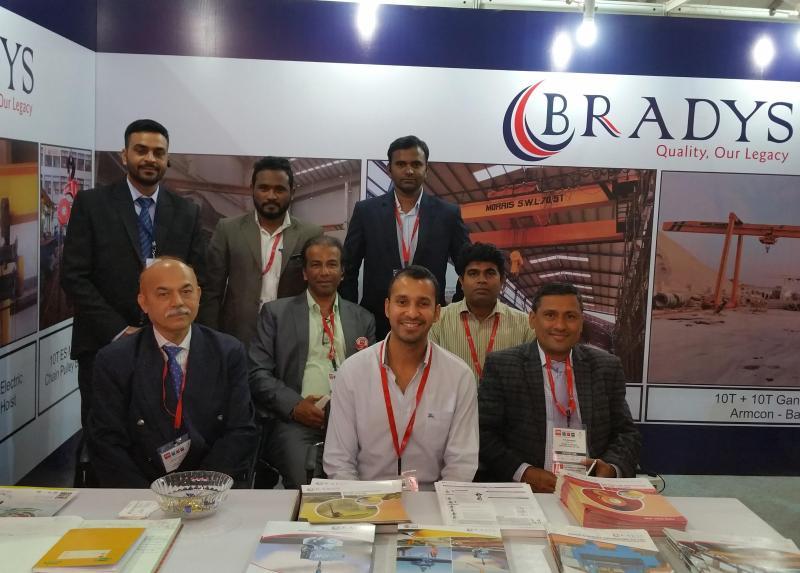
Brady & Morris (est. 1946) is what happens when industrial engineering refuses to die… or pay dividends.
- EPS went from ₹14 in FY23 to ₹106 in FY25. That’s not a typo.
- OPM shot up from 6% in FY22 to 13% in FY25.
In the background? Land sales, cash flow resurrection, and a steady pipeline of large engineering contracts.
3. Business Model (WTF Do They Even Do?)
They manufacture heavy-duty equipment:
- EOT Cranes
- Hoists
- Winches
- Lifting gear for nuclear plants, steel factories, and metros
This isn’t just nuts-and-bolts—it’s mission-critical machinery. Brady & Morris operates in a niche, low-competition zone with deep customization.
Revenue split:
- ~95% from material handling equipment
- ~5% from “miscellaneous” sources (read: real estate rights surrendered, cyber frauds recovered, who knows?)
Parent company: W.H. Brady & Co., which holds ~74%. Think of this as the family’s silent cash cow.
4. Financials Overview
| Metric | FY23 | FY24 | FY25 |
|---|---|---|---|
| Revenue | ₹60 Cr | ₹75 Cr | ₹90 Cr |
| Net Profit | ₹5 Cr | ₹8 Cr | ₹24 Cr |
| EPS | ₹22.4 | ₹37.4 | ₹106.7 |
| ROE | 22% | 37% | 23% |
| OPM | 12% | 16% | 13% |
CAGR (3Y):
- Revenue: 25%
- Profit: 39%
- Stock price: 153%
One caveat: ₹19.9 Cr in FY25 was “Other Income” (land deal). Still, even without it, they’re lifting.
5. Valuation
Let’s lift some valuation weights:
Method 1: PE-based
- Normalized EPS (ex-other income): ₹30–40
- Reasonable PE (Smallcap Engg.): 25–30x
- FV range = ₹750 – ₹1,200
Method 2: EV/EBITDA
- EBITDA FY25: ~₹12 Cr
- EV/EBITDA: 10–12x
- FV = ₹120 – ₹140 Cr market cap → Per share = ₹1,070 – ₹1,250
Current price = ₹1,747
Verdict: Already priced like it won a crane-lifting contest. But momentum + scarcity = still a cult bet.
6. What’s Cooking – News, Triggers, Drama
- Cyber Fraud (Jan 2024): ₹4.4 Cr gone. And they forgot to inform SEBI in time.
- Property windfall: Brady Estates surrendered ₹7.41 Cr worth property rights to the company.
- Management Shuffle: Vaibhav Morarka promoted to Vice Chairman & MD—dynasty mode activated.
- ESM Restriction: BSE placed them in Enhanced Surveillance Measure (ESM) in 2023. Suspicious spike? Likely.
Moral: This stock has more plot twists than a K-drama.
7. Balance Sheet
| FY25 Balance Sheet (₹ Cr) | Value |
|---|---|
| Equity + Reserves | 47 |
| Borrowings | 9 |
| Other Liabilities | 21 |
| Total Assets | 77 |
| Fixed Assets | 9 |
| Investments | 0 |
| Other Assets (incl. cash) | 66 |
Key Points:
- Cash & Receivables up = possibly from property or land sale
- Debt is low & falling
- Net worth doubled in 3 years
8. Cash Flow – Sab Number Game Hai
| Cash Flow (₹ Cr) | FY23 | FY24 | FY25 |
|---|---|---|---|
| Operating CF | ₹5 | ₹6 | ₹-1 |
| Investing CF | ₹-1 | ₹1 | ₹23 |
| Financing CF | ₹-4 | ₹-7 | ₹0 |
| Net Cash Flow | ₹0 | ₹0 | ₹23 |
Insights:
- FY25’s ₹23 Cr investing inflow = land rights sale
- Operating cash is volatile—still early days of scale
- Dividend = still missing
9. Ratios – Sexy or Stressy?
| Ratio | FY23 | FY24 | FY25 |
|---|---|---|---|
| ROCE | 25% | 40% | 25% |
| ROE | 22% | 37% | 23% |
| Debtor Days | 85 | 99 | 93 |
| Inventory Days | 110 | 104 | 122 |
| CCC (days) | 136 | 148 | 142 |
| PE | ~47 | ~40 | ~17 (ex-other income) |
It’s tight. Slightly high CCC, but margins are compensating. ROCE is fantastic.
10. P&L Breakdown – Show Me the Money
| FY | Sales | OPM % | Net Profit | EPS |
|---|---|---|---|---|
| FY22 | ₹47 Cr | 11% | ₹3 Cr | ₹14.18 |
| FY23 | ₹60 Cr | 12% | ₹5 Cr | ₹22.44 |
| FY24 | ₹75 Cr | 16% | ₹8 Cr | ₹37.38 |
| FY25 | ₹90 Cr | 13% | ₹24 Cr | ₹106.71 |
OPM rising. EPS exploding. But… no dividend = classic old-school hoarder play.
11. Peer Comparison
| Company | CMP | PE | ROE | OPM | Market Cap |
|---|---|---|---|---|---|
| BEML Ltd | ₹4,594 | 65 | 10.5% | 12.5% | ₹19,148 Cr |
| Action Construction | ₹1,179 | 34 | 28.7% | 15.2% | ₹14,052 Cr |
| Ajax Engg. | ₹678 | 29 | 25.1% | 15.3% | ₹7,764 Cr |
| Brady & Morris | ₹1,747 | 47 | 23.4% | 12.7% | ₹393 Cr |
Peer Verdict:
Cheaper peers available—but Brady wins in niche focus and “hidden triggers” valuation.
12. Miscellaneous – Shareholding, Promoters
- Promoter Holding: 74% and unchanged since forever
- DII Holding: Negligible
- Public Holding: ~26% but small float
- Shareholder Count: Grown from 900 to 2,800 in 2 years (retail interest rising)
Also: No preference for dividends, ESOPs, or splits. Pure old-money vibes.
13. EduInvesting Verdict™
Brady & Morris is not your typical capital goods player. It’s small, niche, profitable, and deeply undervalued until recently. However:
- 25%+ ROCE
- Explosive profit growth (even if FY25 was partly “other income”)
- Land sales and family management mean this is still a backdoor asset story
But it’s also:
- illiquid
- no dividend candy
- at risk of ESM halts & occasional drama (like cyber fraud)
Perfect for: Value investors with high-risk tolerance and love for obscure compounders.
Not for: “Monthly SIP se dividend milega” gang.
Metadata
– Written by EduInvesting Research | 14 July 2025
– Tags: BradyMorris, CapitalGoods, MicroCap, Cranes, MorarkaGroup, Compounders, ValueStocks
