1. At a Glance
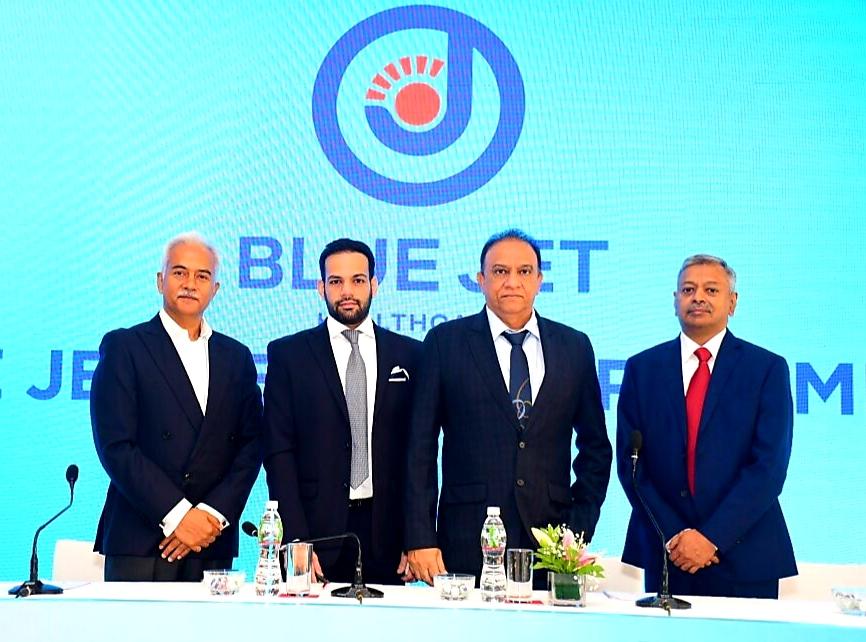
Blue Jet Healthcare delivered a banger Q1 FY26 with 117.8% YoY revenue growth and 141% jump in PAT. But Mr. Market dropped the stock 10%. Why? Because even jet engines can overheat if priced at 52x earnings.
2. Introduction with Hook
If Warren Buffett and Elon Musk co-founded a pharma company, it might look like Blue Jet Healthcare. Why?
- 40%+ ROCE. ✅
- 37%+ EBITDA margin. ✅
- Zero-debt, zero-nonsense. ✅
Yet, this company got slapped -10% in a single day despite delivering a result most pharma companies would kill for. Why? Because the market finally noticed that even sugar-free saccharin isn’t free of valuation diabetes.
3. Business Model (WTF Do They Even Do?)
Blue Jet is a specialized pharma intermediate manufacturer. They’re not making Crocin or Cough Syrup — they’re in the background, making contrast media intermediates that help doctors look inside your organs without opening you up.
Core Segments:
- Contrast Media Intermediates – 68% of revenue (used in MRI/CT scan diagnostics)
- High-intensity Sweeteners – 20% (Saccharin & salts)
- Pharma Intermediates/CMO – 12% (contract manufacturing)
And no, they don’t sell to baba clinics in Chandni Chowk — their client list includes Top 3 global contrast media players.
4. Financials Overview
FY25 (vs FY24):
- Revenue: ₹1,030 Cr → ₹1,222 Cr (18.7%)
- EBITDA: ₹378 Cr → ₹454 Cr (20%)
- PAT: ₹305 Cr → ₹359 Cr (17.7%)
Q1 FY26 YOY:
- Revenue: ₹1,630 Cr → ₹3,548 Cr (117.8%)
- PAT: ₹378 Cr → ₹912 Cr (141.3%)
- OPM: 34.1%
Blue Jet doesn’t just print money — it prints high-margin, patent-backed money with very little debt, and almost no interest cost.
5. Valuation
Let’s take a breather.
Current Market Cap: ₹15,700 Cr
TTM PAT: ₹359 Cr
P/E: 52x
Book Value: ₹65 → P/B: 13.9x
Fair Value Range Estimate:
| Valuation Method | Assumption | FV Estimate |
|---|---|---|
| PE 30x (Aggressive Margin Pricing) | 359 Cr PAT | ₹10,770 Cr → ₹620/share |
| PE 40x (Optimistic Growth Pricing) | 359 Cr PAT | ₹14,360 Cr → ₹826/share |
| DCF (20% CAGR for 5 years) | 15% WACC | ₹900–950/share |
Verdict:
At ₹906, the stock is already priced for perfection… and a Nobel Prize.
6. What’s Cooking – News, Triggers, Drama
Positives:
- Announced stellar Q1 FY26 results
- Growing interest from FIIs (despite low %)
- Pharma CMO segment gaining traction
Negatives:
- Working capital days ballooned to 225 days
- Inventory Days = 209 (are they hoarding saccharin for an apocalypse?)
Upcoming Triggers:
- Global CMO contract wins
- Capacity expansion monetization
- Rising adoption of diagnostic imaging globally
7. Balance Sheet
| Particulars (₹ Cr) | Mar 2023 | Mar 2024 | Mar 2025 |
|---|---|---|---|
| Equity Capital | 35 | 35 | 35 |
| Reserves | 647 | 811 | 1,098 |
| Total Debt | 5 | 3 | 20 |
| Total Assets | 862 | 1,059 | 1,418 |
| Investments | 189 | 250 | 187 |
Key Takeaway:
No red flags. It’s practically a Maruti Suzuki of pharma — debt-free and reserved.
8. Cash Flow – Sab Number Game Hai
| ₹ Cr | FY23 | FY24 | FY25 |
|---|---|---|---|
| CFO | 142 | 241 | 46 |
| CFI (Investments) | -147 | -264 | -35 |
| CFF (Finance) | -4 | -2 | -19 |
| Net Cash Flow | -10 | -24 | -8 |
Observation:
Cash from operations dropped in FY25 due to working capital stretch. Someone’s not collecting invoices on time.
9. Ratios – Sexy or Stressy?
| Metric | FY24 | FY25 |
|---|---|---|
| ROCE | 30% | 41% |
| ROE | 30.8% | 31% |
| Debtor Days | 91 | 124 |
| Inventory Days | 151 | 209 |
| Cash Conversion Cycle | 206 | 262 |
| Working Capital Days | 93 | 225 |
Takeaway:
ROCE is 🔥 but CCC = 262 days is 🧊. They’re profitable but slow-moving on cash.
10. P&L Breakdown – Show Me the Money
| ₹ Cr | FY23 | FY24 | FY25 |
|---|---|---|---|
| Revenue | 721 | 712 | 1,030 |
| EBITDA | 219 | 231 | 378 |
| EBITDA Margin % | 30% | 32% | 37% |
| PAT | 160 | 164 | 305 |
| PAT Margin % | 22% | 23% | 30% |
Observation:
Margins are going up. This ain’t a price-war biz — it’s a moat-built chemical monopoly in its niche.
11. Peer Comparison
| Company | P/E | ROCE | OPM % | PAT Margin | CMP/BV | Mcap (Cr) |
|---|---|---|---|---|---|---|
| Blue Jet Health | 51.5 | 40.6 | 37.2% | 29% | 13.9 | 15,700 |
| Sun Pharma | 35.1 | 20.2 | 28.8% | 18.4% | 5.6 | 4,02,000 |
| Divi’s Labs | 80.2 | 20.4 | 31.8% | 21.3% | 11.7 | 1,75,000 |
| Zydus | 20.8 | 24.3 | 30.4% | 20% | 4.1 | 96,000 |
Inference:
Blue Jet is priced like it already cured cancer. Compared to peers, it’s rich in margin and even richer in valuation.
12. Miscellaneous – Shareholding, Promoters
Promoter Holding: Stable at 86%
FII Holding: Dipped to 1.97%
DII Holding: Reduced to below 1%
Public Holding: Rising gradually → 11.08%
Investor Count: 70,772 (huge jump, probably retail rushing in post-listing)
Red Flag: Institutions are taking profit while public is buying — classic post-IPO dump symptoms?
13. EduInvesting Verdict™
Blue Jet is a fascinating moat stock with:
- Global niche monopoly
- Asset-light business
- 37%+ EBITDA margins
- 40%+ ROCE and 30%+ ROE
- Zero-debt & free cash flow machine (usually)
But here’s the rub:
At 52x earnings and 13.9x book, it’s trading like a SaaS unicorn, not a pharma intermediate biz. The only thing sweeter than saccharin here is the valuation bubble.
Verdict:
If you’re flying Blue Jet, fasten your seatbelt — it’s high-performance, but valuation turbulence is real.
Metadata
– Written by EduInvesting Team | 22 July 2025
– Tags: Blue Jet Healthcare, Pharma, Q1 FY26, High ROCE, Contrast Media, IPO Stocks, EduInvesting Premium


