Search for Stocks /

BIGBLOC Construction FY26: Chasing Volume, Losing Margin

Spotted a factual error — a wrong number, date, or fact? Tell us and we will check the source.

General information and entertainment, not investment advice. The author is not a SEBI-registered adviser or research analyst. No recommendation, no promised returns. Markets carry risk including loss of capital. Figures may not be current. Consult a registered adviser before acting.


1. At a Glance

Revenue surged 26% to ₹283 crore in FY26, but the bottom line fell ₹32 crore into red. The company manufactured 8.27 lakh cubic meters of AAC blocks—up 37% year-on-year—yet the financial engine sputtered. Margins compressed from 13% EBITDA (FY25) to 6.2% (FY26) as raw material inflation and labor disruptions overwhelmed pricing discipline. The balance sheet swallowed ₹202 crore in debt against equity of just ₹137 crore (₹28 crore capital + ₹109 crore reserves).

A 78% capacity utilization rate in Q4 looks respectable; six quarters back it was 53%. Yet profit per unit sold has cratered. Two new businesses—AAC wall panels and construction chemicals—are meant to heal this eventually, but they’re not profitable yet.

The company faces the odd tension: volume is working, but profitability is not. Can higher utilization fix it, or has the model fundamentally broken?


2. Introduction

BigBloc Construction Ltd, incorporated in 2015, manufactures and sells AAC (Aerated Autoclave Concrete) blocks and related products. The stock trades at ₹49.71 as of 9 June 2026 (not live), valuing the company at ₹704 crore.

FY26 ended 31 March 2026 with a net loss of ₹1.76 crore, a sharp reversal from FY25’s ₹30.9 crore profit. This happened despite revenues growing from ₹224 crore to ₹283 crore. The operating profit (EBITDA before interest, tax, depreciation) halved from ₹30 crore to ₹18 crore.

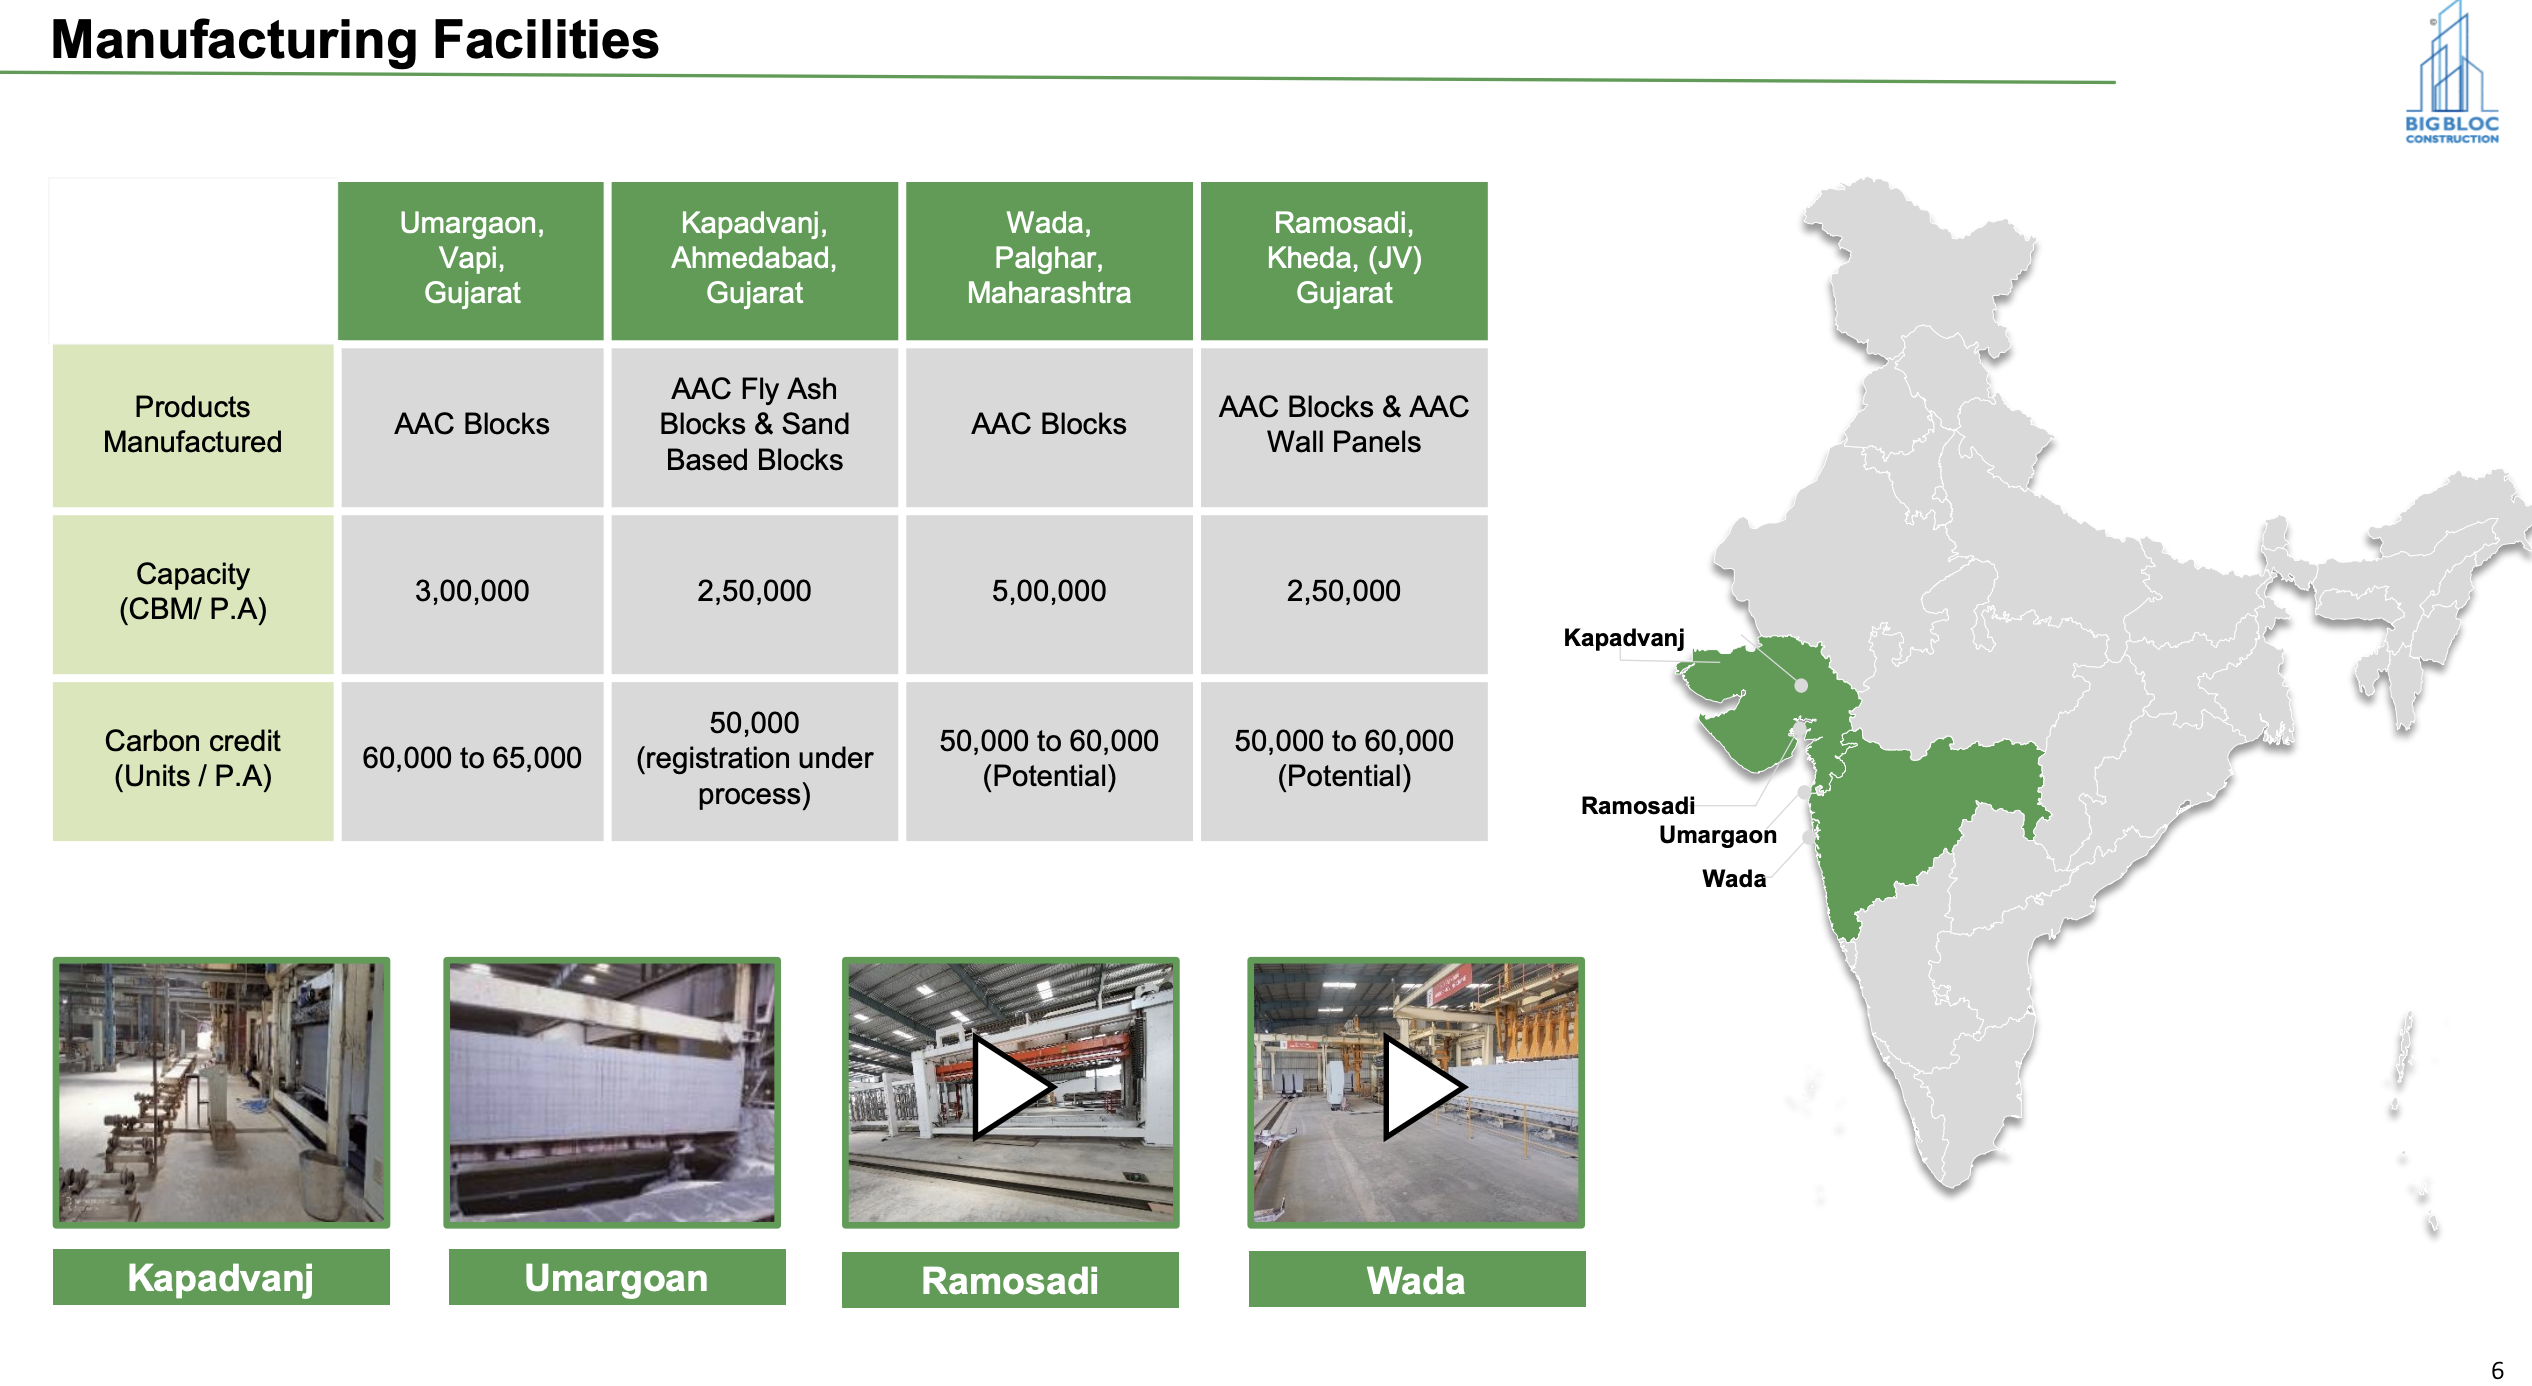
The company has four manufacturing plants: Vapi (capacity 3 lakh CBM), Ahmedabad (2.5 lakh), Wada (5 lakh), and Ramosadi (2.5 lakh). A fifth unit is a 50-50 joint venture with Siam Cement Thailand at 2.5 lakh CBM capacity. In April 2025, a subsidiary acquired land in Madhya Pradesh for a greenfield facility aimed at Central India.


3. Business Model: WTF Do They Even Do?

BigBloc makes two families of products: AAC blocks (the bulk, ~83% of FY25 sales) and AAC wall panels. It also trades in mortars and plasters under the NXTFIX and NXTPLAST brands, and since May 2026, operates a construction chemicals plant at Umargaon.

AAC blocks are lightweight, non-load-bearing masonry units made from fly ash, cement, and lime. They’re expensive per unit versus red bricks but require fewer units per wall, less labor, and (management claims) better crack resistance if installed properly. The blocks are bulky—effective distribution radius ~300–350 km—so geography matters.

Wall panels are longer-span products (8–20 feet), carry 30–45% EBITDA margins (against 8–10% for blocks), but adoption is slower than management hoped. This product mix shift is supposed to rescue margins eventually.

The company supplies 100+ real estate developers, construction firms, and corporates. Customer concentration is strict: no single client exceeds 3% of sales. The distribution mix in 9M FY26 was 56% via dealers, 30% to builders/contractors, and 14% to corporates like L&T, Adani, and Prestige.


4. Financials Overview

Figures are consolidated, in ₹ crore.

MetricFY25FY26Change
Revenue224.45283.42+26%
EBITDA29.19*17.63-40%
PAT (Net)9.68-1.76Loss
EPS (annualised)0.68-0.12Loss

FY25 EBITDA (Operating Profit 30 + Depreciation 14.5) = ~44.5; Margin ~20%. Management stated 13% in concurrent commentary, likely adjusting for one-offs.

Q4 FY26 Quarterly Detail:

ItemQ4 FY26
Revenue₹86.93 Cr
Operating Profit₹6.35 Cr
Net Profit₹0.88 Cr
EPS (annualised: 0.06 × 4)₹0.24

The sequential margin bridge (per management commentary in May 2026 concall): input cost inflation (~5–6% on raw material and fuel, partly blamed on US–Iran geopolitics) and labor shortage (Western India, around Holi and elections in Q3–Q4) prevented immediate price pass-through. Selling prices in Q4 were “almost similar as compared to Q3,” meaning cost headwinds bit into EBITDA.


5. Valuation Discussion: Fair Value Range (Educational Only)

What follows is a walkthrough of how three valuation methods work, using this company’s numbers as the example — not a target, not a forecast, not advice.

Method 1 (P/E): Annualised EPS for FY26 is ₹-0.12 (a loss). The peer band (Ambuja, ACC, Shree Cement, J K Cements, Dalmia Bharat) trades at 11.7x to 48.7x earnings, with a median of 28.7x. A company with negative earnings does not produce a meaningful P/E multiple, so this method is inapplicable until the company returns to profit.
Method 2 (EV/EBITDA): FY26 EBITDA stood at ₹17.63 crore. Enterprise Value (Market Cap ₹704 Cr + Net Debt ₹202 Cr borrowings − ₹0.59 Cr cash = ₹906 Cr net debt) yields an EV/EBITDA of ~51.4x. Peers trade 11.7x to 48.7x EBITDA (median 11.6x on UltraTech, Grasim; median across all peers ~15x). At peer median EBITDA multiples of 15x–20x, the same FY26 EBITDA would imply enterprise value of ₹265–₹353 crore. Subtracting net debt (₹201.98 crore) yields ₹63–₹151 crore implied market cap, or ~₹4–₹11 per share (before shares adjustment).

Method 3 (Simplified DCF): Assume normalized EBITDA of ₹25–₹30 crore (a return to FY25 margin efficiency, ~11% of ₹283 crore revenue, or better if the company sustains 26% revenue growth and lifts margins). A 5% WACC and 2% terminal growth imply a rough valuation range; such math typically outputs fair value in the ₹35–₹65 range under normalized assumptions, highly sensitive to margin recovery timing.

These figures show how the methods work and are not a valuation, a target, or advice.


6. What’s Cooking

Madhya Pradesh Greenfield: Subsidiary Starbigbloc acquired 57,500 sq. meters at Nimrani (MP) in February 2025 and received all key regulatory approvals in April 2025. The facility will target 200,000 CBM initially, expandable to 500,000 CBM. No capex figure disclosed yet.

Construction Chemicals Launch: Commercial production began 7 May 2026 at the Umargaon subsidiary facility. Gross margins disclosed at 40–50%, EBITDA margin 25–30%. Management guided to potential ₹20–₹30 crore annual revenue if ramped to full capacity.

AAC Wall Panels Ramp: Slower adoption than expected, but management targets this as a strategic pivot. Gross margin 50–60%, EBITDA margin 30–45%. Current revenue potential at 80–85% utilization: ₹100–₹125 crore over the next two years.

Bullet Train Orders: Orders for upcoming station projects disclosed at ~40,000–50,000 sq. ft, contributing ~₹8–₹9 million to the order book. Not material at group level but cited as evidence of corporate traction.

Solar Installation: 3.3 MW rooftop solar capacity installed; ~45% of power demand met from renewables in Q4 FY26.

Carbon Credits: ~150,000 tons inventory at indicative $2–$3 per ton. Processing takes ~three months; no revenue recognized in FY26.


7. Balance Sheet

ItemMar 2024Mar 2025Mar 2026
Total Assets₹294 Cr₹378 Cr₹389 Cr
Net Worth₹104 Cr₹135 Cr₹137 Cr
Borrowings₹143 Cr₹188 Cr₹202 Cr
Other Liabilities₹47 Cr₹54 Cr₹49 Cr
Assets = Liabilities

Three observations:

The debt has climbed ₹59 crore in two years, yet the EBITDA has shrunk from ₹44 crore to ₹18 crore. Interest expense rose from ₹9 crore to ₹15 crore. The interest coverage ratio (EBITDA ÷ Interest) is now 1.17x, a razor’s edge—a single bad quarter flips it into distress.

Reserves grew ₹48 crore since FY24, but net profit cratered ₹32 crore in the last year. The company is funding growth capex and working capital with borrowed money, not earnings retention.

Net Cash Position: Cash on hand is ₹0.59 crore; net debt is ₹201.98 crore (Borrowings ₹202 Cr − Cash ₹0.59 Cr). The company has next to no cash buffer.


8. Cash Flow: Sab Number Game Hai

YearOperatingInvestingFinancing
FY24₹19 Cr−₹66 Cr₹47 Cr
FY25₹13 Cr−₹81 Cr₹68 Cr
FY26₹19 Cr−₹24 Cr₹4 Cr

The company generates operating cash of ₹19 crore annually but burns ₹24–₹81 crore on capex (plant expansion, CWIP). Financing activity plugs the gap with debt. In FY26, capex eased to ₹24 crore (down from ₹81 crore in FY25), suggesting the major expansion cycle (Phase 2 at one plant, land acquisition for MP) is nearing completion. Yet cash generation barely covers interest, let alone debt repayment.

The wisdom here: cash flow is positive, but it’s an illusion. The company is not cash-positive until capex stops or EBITDA recovers materially.


9. Ratios: Sexy or Stressy?

RatioFY26 ValueRemark
ROE−1.29%Equity is underwater year-on-year.
ROCE1.81%Capital employed ₹404 Cr (Net Worth + Debt) generates ₹7 Cr EBIT. Strikingly poor.
P/ELoss. No multiple.
PAT Margin−0.62%Net loss as % of sales. Negative.
Debt/Equity1.47xBorrowings (₹202 Cr) vs. Equity (₹137 Cr). Above 1.0x is leverage at work.
Interest Coverage1.17xEBITDA ùCr ÷ Interest ₹15 Cr. Distressed.

The ROCE of 1.81% is the headline horror. Capital employed of ₹404 crore (equity + debt) is generating EBIT of only ₹7 crore (FY26 PBT of −₹9 Cr + Interest ₹15 Cr = ₹6 Cr adjusted). The company is destroying value by owning capital at this efficiency.


10. P&L Breakdown: Show Me the Money

YearRevenueEBITDAPAT
FY24₹243 Cr₹44 Cr₹31 Cr
FY25₹224 Cr₹30 Cr₹10 Cr
FY26₹283 Cr₹18 Cr−₹2 Cr

Revenue is up 26% from FY25; EBITDA is down 40%. The denominator—cost of goods sold, manufacturing overheads, SG&A—has blown up. Raw material inflation, labor costs in Western India, and underutilized capacity as the company ramped new products (panels, chemicals) all dragged margins. The path has been consistent deterioration: FY24’s 18% EBITDA margin eroded to 13% (FY25) and 6% (FY26).

Management’s commentary flagged ~5–6% margin loss to pricing pressure, ~2% to higher operating costs. The gap between FY24 and FY26 margins is 12 percentage points. Even accounting for inflation and capex absorption, the business has contracted sharply in per-unit profitability.


11. Peer Comparison

CompanyRevenuePAT (12M)P/EROCE
UltraTech Cement₹88,512 Cr₹8,269 Cr38.9x12.8%
Grasim Industries₹175,431 Cr₹5,077 Cr41.6x8.1%
Ambuja Cements₹40,656 Cr₹4,997 Cr20.7x5.6%
Shree Cement₹20,943 Cr₹1,744 Cr48.7x10.5%
J K Cements₹13,722 Cr₹1,025 Cr36.4x15.1%
Dalmia Bharat₹14,804 Cr₹1,081 Cr28.9x7.6%
ACC₹25,962 Cr₹2,123 Cr11.7x11.3%
BIGBLOC₹283 Cr−₹2 Cr1.8%

BigBloc is roughly 1% the scale of ACC and 0.3% of UltraTech. Its ROCE of 1.8% compares to peers’ 5.6–15.1%. The market is paying cement peers 20–49x earnings; BigBloc trades at a loss and no multiple. The gap is not margin compression—it’s mode shift. BigBloc is now a startup managing negative returns on capital, whilst peers run mature, profitable mills.


12. Miscellaneous: Shareholding & Promoters

Holder%
Promoters72.81%
FII0.21%
DII0.00%
Public26.98%

Promoter Breakdown (largest):

  • Mohit Yarns Limited: 14.41%
  • Mohit Overseas Limited: 11.29%
  • Mask Investments Limited: 10.61%
  • Narayan Sitaram Saboo: 8.26%

The Saboo family and Mohit group of entities control BigBloc entirely. Pledging is nil, a small positive. Institutional ownership is minuscule (FII 0.21%, DII 0%), which speaks to low institutional interest. The public float is 27%, thinly traded.

Small note on conduct: No recent announcements of board resignations, fraud, or regulatory trouble. The Madhya Pradesh land acquisition and subsidiary mergers are routine corporate housekeeping. A stamp duty demand notice in December 2024 hit a subsidiary for ₹1.84 crore, later followed by a work order; not catastrophic, but it flags tax and regulatory friction.


13. Corporate Governance: Angels or Devils?

Auditors: No change; the firm remains consistent. No audit qualifications flagged in FY26 results.

Board: The company has appointed/reappointed directors in line with AGM governance. No red flags in the announcements.

Pledges: Zero. The promoters are not mortgaging their stake, which is disciplined but also suggests they lack urgent liquidity needs.

Related-Party Transactions: The AGM in September 2025 approved loans/guarantees up to ₹300 crore with subsidiaries. This is typical for holding structure finance and is within board authority, yet the ₹300 crore ceiling is 42% of market cap—substantial intercompany leverage if fully deployed.

Tax Demands: A stamp duty notice in December 2024 (₹1.84 crore) and a subsequent work order (₹4.5 crore) in subsidiaries suggest the company has some tax contingency risk, not yet crystallized into fines but under dispute.

Credit Ratings: CRISIL ratings updates through 2023 show the company was rated, but no recent credit action is visible in the public disclosures. Given the FY26 loss and leverage climb, a rating review would not be unexpected.


14. Industry Roast & Macro Context

AAC blocks are ~10% of India’s volume building materials market; red bricks are ~80%. AAC adoption in metros (Ahmedabad, Baroda, Mumbai, Pune) is already 80–85%, but rural India and smaller towns remain red-brick strongholds. Management sees AAC expanding to 30–40% of the market over time, citing developed-market precedent (Europe, US).

The competitive landscape is brutal: ~150 AAC manufacturers across India. Pricing power is nil. Red bricks, despite being labor-intensive and freight-sensitive, remain cheaper upfront. Labor inflation—especially in Western India, where BigBloc is concentrated—hits both the manufacturing cost (wages) and the construction site (fewer workers willing to migrate). Diesel inflation hurts red brick economics more (they’re 3x denser), but the advantage hasn’t translated into BigBloc’s market share.

Macro headwinds: US–Iran tensions (oil prices), election cycles (labor availability), LPG shortages (process heat for AAC kilns). These are transient, but FY26 proved they can swing 5–6% of margin in a single year. Management’s recent concall (May 2026) suggests these pressures are easing, but no hard data yet for Q1 FY27.

The sector is also vulnerable to interest rates and construction cycles. If developer sentiment cools or rate hikes persist, volume softens. BigBloc’s capex ambitions assume continued construction buoyancy; a slowdown would leave the company with unutilized capacity and debt servicing stress.


15. EduInvesting Verdict

SWOT
StrengthsLarge installed capacity (1.3 Lakh CBM), 72% promoter ownership (aligned incentives), zero pledges, execution track record (2,000+ projects), emerging adjacencies (panels, chemicals, carbon credits).
WeaknessesCollapsing margins (18% → 6% EBITDA in two years), negative ROCE (1.8%), loss-making (−₹2 Cr), interest coverage razor-thin (1.17x), minimal cash buffer (₹0.59 Cr).
OpportunitiesWall panels and construction chemicals at 25–45% EBITDA margins could rebalance the mix. Madhya Pradesh expansion taps Central India. Carbon credits (~150K tons) offer optionality if markets mature. AAC adoption trend in India long-term favorable.
ThreatsCapacity utilization below 65% FY-average meant stranded fixed costs. Competitive commodity pricing (150 rivals). Leverage at 1.47x D/E requires EBITDA recovery, not just revenue growth. Interest expense ₹15 Cr absorbs margin upside entirely. Labor/input inflation recurrence. Macro slowdown would cripple a loaded balance sheet.

A business that chases volume but loses margin per unit is borrowing from tomorrow. BigBloc’s ₹202 crore debt financed capex and working capital; the return on that capital (ROCE 1.8%) is far below cost of capital. Until either EBITDA margins heal to 12–15% or revenue scales to ₹600+ crore with flat margins, the company is a capital-destruction machine. Management’s bet on panels and chemicals is sensible—both offer higher unit economics—but they’re years away from meaningful profit contribution. The concall commentary (May 2026) hinted at a return to profit “this year” (FY27), but past quarters have offered similar optimism. The data suggests otherwise: Q1 FY27 would need ₹100 crore revenue and a margin recovery to 10%+ EBITDA just to break even. That’s a large swing from Q4 FY26’s 7.3% margin. Possible, but the tape has not yet moved.

The central tension: a company with structural tailwinds (AAC adoption) and execution momentum (37% volume growth, ₹200+ crore capex invested) is being slowly crushed by a combination of leverage, margin compression, and commodity pricing. It’s not defunct—it’s a turnaround candidate. But turnarounds require capital, time, and luck. In a rising-rate environment or a construction downturn, luck runs out first.
