Search for Stocks /

Bharat Gears FY26: Profit Quadruples to ₹16.5 Cr While the Boardroom Files Its Own Disclosures

Spotted a factual error — a wrong number, date, or fact? Tell us and we will check the source.

General information and entertainment, not investment advice. The author is not a SEBI-registered adviser or research analyst. No recommendation, no promised returns. Markets carry risk including loss of capital. Figures may not be current. Consult a registered adviser before acting.


1 — At a Glance

Bharat Gears closed FY26 with revenue of ₹784 crore, its highest in the decade on record, up from ₹648 crore the year before. Net profit landed at ₹16.5 crore, against ₹3.2 crore in FY25 and a ₹9.7 crore loss in FY24. Operating profit roughly doubled to ₹52 crore, and the operating margin recovered to about 7% after two years stuck near 4%.

The market caps the company at ₹195 crore and pays 11.8x earnings, against a peer median near 27x. CARE upgraded the bank facilities to CARE BBB; Stable in March 2026, citing better profitability and lower debt after a non-core land sale funded prepayments.

That is the operating picture, and it reads well. The governance picture, filed in the same quarter, reads differently: the outgoing Joint Managing Director raised concerns about the Chairman’s practices on his last day, an external agency was appointed to assess them, and a separate matter over the Chairman’s citizenship has been winding through filings since November 2025.

A company can have its best earnings year and its busiest disclosure year at the same time. This is what that looks like on one page.

2 — Introduction

Incorporated in 1971, Bharat Gears is among India’s larger suppliers of automotive gears, with manufacturing at Faridabad near Delhi, Mumbra near Mumbai, and Satara in Maharashtra.

The business sells into cyclical end-markets — tractors, commercial vehicles, construction equipment — and FY26 caught an up-cycle. Quarterly revenue climbed from ₹166 crore in the June quarter to ₹210 crore by March, the strongest in the visible series.

Recent corporate activity has been dense. In FY25 the company sold a non-core land parcel and used the proceeds to prepay term loans, a move CARE flagged as central to its March 2026 upgrade. In June 2026, the company put ₹1.27 crore into a solar SPV, Hexa Energy HR5, for a 29.55% stake to procure captive power for two units. Around the same window, the board declared its first dividend in years and a leadership transition opened a still-unresolved set of disclosures, covered in Section 13.

3 — Business Model: WTF Do They Even Do?

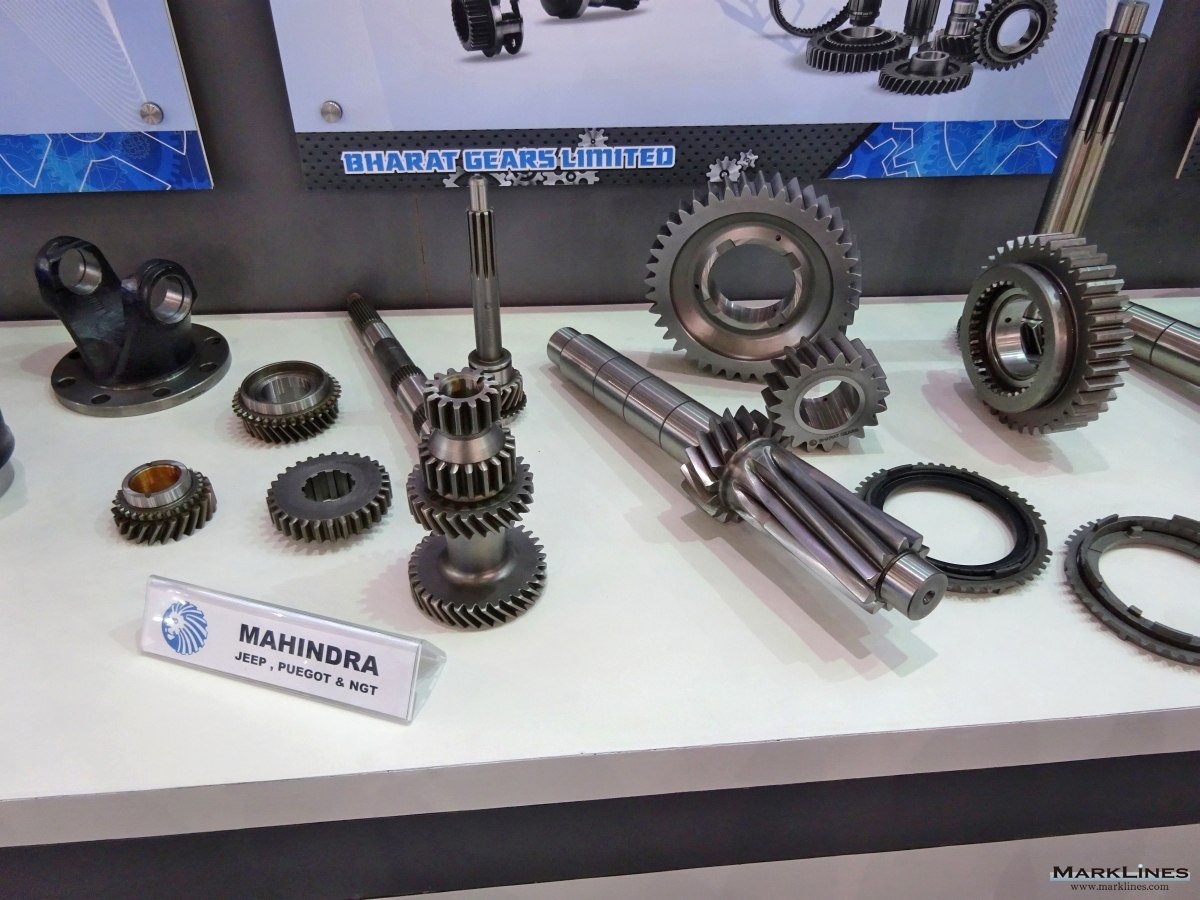
They cut metal into circles with teeth, harden it, and ship it to people who build tractors and trucks. Ring gears, pinions, transmission gears, differential gears, axle shafts, and assorted driveline parts make up the bulk; a separate division builds the industrial heat-treatment furnaces that harden such parts — meaning the company sells both the gears and, occasionally, the ovens that bake them.

The customer roster is blue-chip and concentrated. CARE notes the John Deere group alone has contributed roughly 35–45% of revenue over five years, and the top ten customers over half — comforting until you remember concentration is a two-way door. Mahindra, Carraro, Escorts Kubota, Eaton and ZF round out a list that reads like an OEM conference badge wall.

The mix tilts agricultural: tractor-linked machinery sits around 60% of segment revenue in the latest split, commercial vehicles near 16%, construction equipment near 15%. That farm tilt is why a good monsoon matters more to this P&L than any product launch.

The structural drag is cost. CARE puts employee expense at roughly 18–19% of operating income, attributing it to legacy manpower and trade unions at the plants. So margins live and die by how much revenue gets spread over that fixed wage bill — in a weak year the costs don’t flex, and in FY26 the higher volume finally gave those costs something to sit on.

Does a 60%-tractor revenue base make this a gear company or a rain-dependent one? The order book is the same either way.

4 — Financials Overview

Figures are consolidated, in ₹ crore. FY26 is the latest annual period.

MetricFY26FY25YoY
Revenue784648+21%
Operating Profit5225+108%
PAT16.53.2+416%
EPS (₹)10.752.08+417%

Revenue grew 21%, and because the cost base barely moved, operating profit more than doubled — the textbook shape of operating leverage on a high-fixed-cost manufacturer. Per CARE, the 9MFY26 margin improvement of about 400 bps came from better absorption of fixed costs amid higher volume.

From the credit report: CARE records FY26 nine-month total operating income up ~21% year-on-year to ₹574 crore, with PBILDT interest cover improving to 3.66x from 1.42x in FY25 after the debt prepayment.

5 — Market Expectations & Historical Multiples

This section describes how the market is currently pricing the company and how that compares with its own history and peer group. It is descriptive, not predictive.

MetricCurrentHistorical AveragePeer Median
P/E11.8x27.4x
ROE13.5%5.3% (5-yr)
ROCE18.2%16.0%
EV/EBITDA4.45x
P/B1.48x

The market currently pays 11.8x earnings here, against a peer median near 27.4x. Return on equity at 13.5% sits well above the company’s own 5-year average of 5.3%, a stretch that included two loss years. ROCE at 18.2% runs slightly ahead of the peer median near 16%.

What the market appears to be pricing is a single recovered year against a long record of volatility: revenue CAGR of about 9% over five years, profitability that CARE notes has swung between 3.45% and 8.98% PBILDT margin across the period, and an end-market tied to farm and commercial-vehicle cycles. The multiple sits below the peer set; the peer set, on the data, also carries steadier margins.

One factual observation on market expectations: the company trades at under half the peer P/E while posting a one-year profit recovery the peer set largely did not need to make.

6 — What’s Cooking

Four filed items, all from the dump’s announcements:

The board recommended a ₹1 final dividend for FY26 — the first payout in years, against a string of zero-dividend years on record. It also appointed Naresh Kumar Verma and did not extend Joint MD Sameer Kanwar, whose tenure ended 31 May 2026.

The company invested ₹1.27 crore for a 29.55% stake in Hexa Energy HR5, a newly incorporated solar SPV with nil revenue across its three reported years, to procure captive power for the Faridabad and Mumbra units under a November 2025 power-purchase agreement.

CARE upgraded the bank facilities — ₹46.77 crore, ₹45.00 crore and ₹133.23 crore — to CARE BBB; Stable and short-term to A3+ in March 2026.

The remaining filings concern governance, and they get their own section.

7 — Balance Sheet

ItemFY24FY25FY26
Total Assets385364401
Net Worth111113131
Borrowings1138073
Other Liabilities162172197
Total Liabilities385364401

Assets equal liabilities in every column, as they should.

  • Borrowings spent two years quietly losing weight — from ₹113 crore to ₹73 crore — funded in part by a land sale rather than by the business throwing off the cash itself.
  • Net worth rose to ₹131 crore largely on the year’s retained profit; the equity finally added something other than accumulated patience.
  • Other liabilities at ₹197 crore now exceed borrowings nearly threefold — CARE attributes this to heavy reliance on supplier trade credit.

Cash and bank stood at ₹7.7 crore against ₹73 crore of borrowings, so this is a net-debt balance sheet, not a net-cash one.

A balance sheet can deleverage on a land sale or on operations; only one of those repeats.

8 — Cash Flow: Sab Number Game Hai

YearOperatingInvestingFinancing
FY2447-13-37
FY25492-51
FY2629-8-31

Operating cash flow fell to ₹29 crore in FY26 from ₹49 crore, even as profit quadrupled — the gap sits in working capital, with receivables and inventory both rising as revenue climbed. FY25 investing turned positive at ₹2 crore on the land-sale proceeds, and financing has been steadily negative for three years as debt was repaid.

A profit that grows while operating cash shrinks is a reminder that the income statement and the bank balance run on different calendars.

9 — Ratios: Sexy or Stressy?

RatioValue
ROE13.5%
ROCE18.2%
P/E11.8x
PAT Margin2.1%
D/E0.56

ROE at 13.5% reflects one strong year sitting on a thin equity base; the 5-year average of 5.3% shows the equity has historically worked part-time. ROCE of 18.2% indicates the operating assets earned their keep in FY26. PAT margin at 2.1% is the honest number here — ₹16.5 crore of profit on ₹784 crore of revenue leaves almost no cushion before a cost shock. D/E of 0.56 marks the leverage at its lowest in the visible series after the prepayments.

10 — P&L Breakdown: Show Me the Money

YearRevenueOp. ProfitOther IncomePATEPS (₹)
FY24663243-9.7-6.34
FY2564825193.22.08
FY2678452616.510.75

The Other Income column carries the FY25 story. That year’s ₹19 crore of other income sat almost level with ₹25 crore of operating profit — and CARE records a non-core land sale for roughly ₹17 crore in FY25. So the slim FY25 profit of ₹3.2 crore leaned heavily on a one-off, not on gears. FY26 is the cleaner year: ₹52 crore of operating profit against just ₹6 crore of other income, so the ₹16.5 crore profit is mostly the business doing business.

EPS moved with PAT across all three years, so there’s no share-count distortion here; the swing from −₹6.34 to ₹10.75 is a real earnings swing, not a dilution artefact.

11 — Peer Comparison

CompanyRevenue (Qtr)PAT (Qtr)P/E
Bharat Gears2105.111.8x
Bharat Forge4,52823385.3x
Schaeffler India2,50732051.4x
Uno Minda5,33635252.2x
Sona BLW1,17220758.2x
Peer Median (123 co.)27116.627.4x

Bharat Gears carries less than half the peer median multiple while sitting below the median on both quarterly revenue and profit. The contrast with the marquee names is one of scale and steadiness: Bharat Forge runs at roughly 21x the quarterly revenue and seven times the multiple. This is a small-cap gear maker priced like one, in a peer set priced for growth it has not consistently shown.

12 — Miscellaneous: Shareholding & Promoters

Holder%
Promoters55.33%
Institutions1.44%
Public43.23%

Promoter holding has sat unchanged at 55.32–55.33% across the entire visible window — no buying, no selling, just steadiness. Surinder Paul Kanwar, Chairman and Managing Director, holds 37% personally; Ultra Consultants holds another 14%. CARE credits the promoters with over four decades in the industry. Institutions are a rounding error at 1.44%, with a single emerging-markets micro-cap fund holding most of it. The public float, near 43%, spreads across roughly 23,000 shareholders.

13 — Corporate Governance: Angels or Devils?

This is the section the filings filled.

On 31 May 2026, his last day as Joint Managing Director, Sameer Kanwar shared concerns about certain specific practices by the Chairman, Surinder Paul Kanwar. The audit committee, in a 15 June 2026 meeting, appointed an external agency to carry out an impact assessment and report within a reasonable period.

Days earlier, the company disclosed that the same outgoing JMD had shared unpublished price-sensitive information — draft FY26 results — with third parties and a personal lawyer on 26 May, which the company stated violated its insider-trading code; an inquiry follows.

Separately, an anonymous letter received in November 2025 questioned the Chairman’s citizenship; the MCA sought information, the board obtained legal opinion and in January 2026 stated his status remained unchanged, while an April 2026 filing notes he is appealing a passport revocation with clarification pending.

Pledged shares stand at zero and the credit rating was upgraded over the same period. These are filed facts, recorded as facts: an unresolved external assessment, an open insider-trading inquiry, and a pending citizenship matter, all live as of the latest filings.

14 — Industry Roast & Macro Context

The auto-component sector is where you get to be essential and disposable at once. You supply the OEM with a part it cannot build a vehicle without, then discover the OEM sets the price, the volume, and the payment terms — and that your single largest customer can be a third of your revenue. CARE flags exactly this concentration and the inherent cyclicality of the tractor and commercial-vehicle end-markets that move with rural demand and the broader economy.

Layer on the structural shift CARE names — the gradual move toward environmentally friendlier vehicles and emission rules — and a gear maker has to keep proving its parts belong in whatever gets built next. The sector rewards relationships measured in decades and approval cycles measured in years; it is a slow industry that punishes anyone in a hurry, and tariffs add a variable no component maker controls.

15 — EduInvesting Verdict

StrengthsWeaknesses
Revenue at decade high ₹784 Cr; OP doubled to ₹52 CrPAT margin thin at 2.1%; high fixed wage cost
Debt cut to ₹73 Cr; D/E 0.56; CARE upgradeCustomer concentration (~30%+ single OEM)
OpportunitiesThreats
Operating leverage if volume holds; captive solarOpen governance matters; an external assessment pending
Multiple below peer median at 11.8xCyclical end-markets; raw-material and tariff swings

FY26 is the year the operating business finally showed what it can do without a land sale propping it up — revenue at a record, profit at ₹16.5 crore, margin restored. It is also the year the company filed an unusual run of governance disclosures around the very leadership that steered the recovery.

A best-in-a-decade earnings year and an open list of boardroom questions, arriving in the same set of filings — the numbers and the disclosures pointing in opposite directions, with the external agency yet to report.

Leave a Reply