1. At a Glance
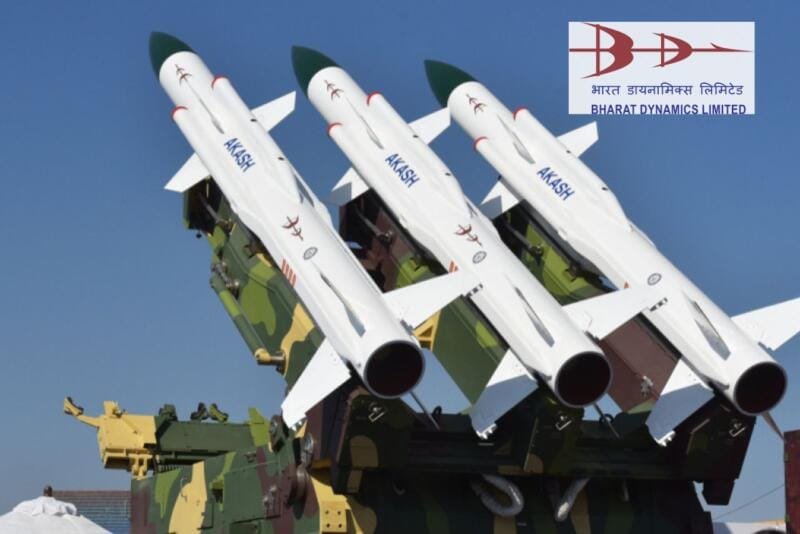
If you thought missiles were fast, wait until you see Bharat Dynamics’ P/E ratio – it’s already orbiting somewhere near the International Space Station at96.9x. This PSU defence manufacturer builds everything from guided missiles to underwater weapons for the Indian Armed Forces. On paper, they’re debt-free and dividend-friendly, but with a five-year sales CAGR ofjust 1.5%, you’d think their order book is stuck at a red light. Still, with defence being the flavour of the decade, this slow-cooking stock remains armed and potentially dangerous… for shorts.
2. Introduction
Picture this:A taxpayer funds a company to make missiles, the company makes missiles, sells them back to the taxpayer’s army, and then pays a dividend back to the taxpayer. This is thedesiversion of a closed-loop ecosystem. Bharat Dynamics Ltd (BDL) has been playing this game since 1970, and unlike certain PSU cousins, they’ve managed to stay scandal-free (mostly) while producing some of India’s most crucial defence tech.
Yet, for all the “national security” glamour, the numbers tell a more… bureaucratic story. Quarterly revenues swing harder than a cricket bat in T20 – from ₹1,777 Cr to ₹248 Cr in just two quarters – making analysts wonder if they operate on a “missiles in bulk, invoices in bulk” model.
And yes, their latest ₹809 Cr ATGM order is nice, but given it’s spread over three years, we’re not exactly talking supersonic revenue acceleration.
3. Business Model (WTF Do They Even Do?)
BDL is essentially India’s in-house missile factory. They produce:
- Guided Missiles– surface-to-air, air-to-air, anti-tank, you name it.
- Underwater Weapons– torpedoes and sub-launched systems.
- Airborne Products– avionics and subsystems for aerial platforms.
- Allied Defence Equipment– support systems and electronics.
- Lifecycle Support– maintenance, refurbishment, and upgrades for everything they’ve sold (because missiles, like cars, need servicing).
Roast moment: Their customer list is shorter than a school notice board – primarily the Indian Army, Navy, and Air Force. Which means while “client concentration” risk is technically high, the client is the Government of India… which
usually pays.Eventually.
4. Financials Overview
Let’s break the FY25 numbers without the sugar coating:
- Revenue (TTM):₹3,402 Cr (up from ₹3,345 Cr in FY24 – that’s barely inflation-beating).
- EBITDA (TTM):₹479 Cr, margin at ~14% (once was 26% in FY22 – margins have clearly been demobilised).
- PAT (TTM):₹561 Cr (down 8.5% from FY24).
- Other Income:₹357 Cr (aka “we made more from cash & investments than from selling missiles in some quarters”).
- ROE:14.4% – decent for a PSU, but not HAL-level.
- Debt:Practically nil (₹2 Cr).
P/E recalculation:Q4 FY25 EPS = ₹7.44 → Annualised EPS = ₹29.76 → New P/E = ₹1,486 / ₹29.76 ≈49.9x(actual forward P/E is way lower than the scary 96.9x TTM).
5. Valuation (Fair Value RANGE only)
| Method | Assumptions | FV |
|---|---|---|
| P/E | Forward EPS ₹29.76 × Industry P/E 40–50 | ₹1,190–₹1,488 |
| EV/EBITDA | EBITDA ₹479 Cr × 18–22x | ₹1,150–₹1,400 |
| DCF | 6% growth, 12% WACC, terminal PE 35x | ₹1,200–₹1,450 |
FV Range:₹1,150 – ₹1,490
Disclaimer:This FV range is for educational purposes only and is not investment advice.
6. What’s Cooking – News, Triggers, Drama
- Fresh ATGM Order:₹809 Cr from Armoured Vehicles Nigam, to be delivered in 3 years.
- Q1 FY26 Results:Net profit ₹18.35 Cr vs ₹7 Cr last year’s Q1


