BF Utilities Ltd: Windmills, Highways, and a 633x P/E Comedy Show
1. At a Glance
BF Utilities is technically a “wind power + infrastructure” company. In reality, it’s a holding maze of Nandi corridor subsidiaries that rake in tolls while the parent’s windmills spin for Bharat Forge’s factories. FY25 standalone sales? Just ₹18.9 Cr. Market cap? A jaw-dropping ₹3,099 Cr. P/E? A stomach-churning 633x. Welcome to a stock where valuation has escaped gravity faster than the wind turbines can spin.
2. Introduction
Let’s cut to it—BF Utilities was born in 2000 with a noble vision: generate clean energy and run infrastructure. Two decades later, it’s like an old Bollywood star clinging to cameo roles.
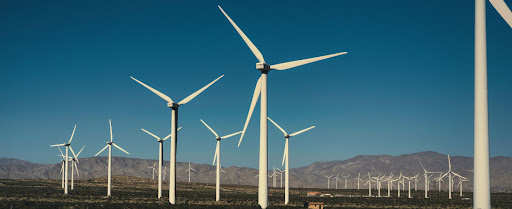
Wind Business: A modest 18.3 MW farm in Satara, Maharashtra. Half of it’s CDM-certified, earning carbon credits back in the good ol’ Kyoto Protocol days. Most power goes straight to Bharat Forge’s Pune plant (because who else will buy it?).
Infra Business: The real meat sits in subsidiaries—Nandi Economic Corridor Enterprises (80% of consolidated revenue) and Nandi Highway Developers (18%). Basically, it’s Bangalore toll booths funding corporate existence.
Revenue Mix: Standalone = 95% wind. Consolidated = 96% infra. So, depending on which lens you use, BF Utilities is either a boutique wind operator or a toll-road landlord with side hobbies.
Sounds harmless? Here comes the masala: in May 2025, auditors slapped the books with a qualified opinion on a ₹37 Cr advance. Chairperson resigned. Company Secretary quit. Valuation ballooned to 19x book value. Yet the stock price kept flying. Makes you wonder—what’s fueling this? Wind? Or pure hot air?