


 Ltd: The ₹126 Crore Insolvency Drama Nobody Asked For")


1. At a Glance
AYM Syntex is the polyester yarn wizard that somehow turns volumes of revenue into pinches of profit. Stock trades at a P/E so high (219x) it makes startup valuations look humble.
2. Introduction with Hook
Think of AYM Syntex as a marathon runner who trips at every 5 km mark but still finishes the race. The company spins polyester and nylon yarn for industries from fashion to automotive, yet its net profit is barely visible under a microscope.
Key stats:
- Q1 FY26 loss: ₹3.55 Cr
- Stock P/E: 219 (investors clearly love pain)
3. Business Model (WTF Do They Even Do?)
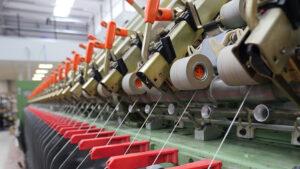
They manufacture polyester, nylon, and BCF yarns. Basically, they take polymers and turn them into threads that end up in your car seats, carpets, and fancy dresses. Sounds solid, but margins suggest they sell yarn like it’s gold and buy raw materials like it’s platinum.
4. Financials Overview
- Revenue (TTM): ₹1,468 Cr
- Net Profit (TTM): ₹6 Cr
- ROE: 2.3%
- ROCE: 8.1%
Margins thinner than the thread they produce.
5. Valuation
- Market Cap: ₹1,275 Cr
- Book Value: ₹98.8
- P/B: 2.2
- P/E: 219
Fair value range? ₹100–₹140. Buying at 218 is like ordering pizza and tipping more than the bill.
6. What’s Cooking – News, Triggers, Drama
- Q1 FY26 loss despite revenues.
- Preferential issue raised ₹141 Cr – funds fully utilized, says the company.
- Promoter holding down to 65.9% (was 74%).
- New independent director James McCallum onboard – fresh perspective, or just another chair filler?
7. Balance Sheet
| (₹ Cr) | Mar 2025 |
|---|---|
| Assets | 1,031 |
| Liabilities | 1,031 |
| Net Worth | ₹577 |
| Borrowings | ₹202 |
Debt reduced – good. But interest cost still gnaws like a rat.
8. Cash Flow – Sab Number Game Hai
| (₹ Cr) | FY23 | FY24 | FY25 |
|---|---|---|---|
| Operating | 118 | 64 | 108 |
| Investing | -74 | -55 | -69 |
| Financing | -39 | -10 | -28 |
Cash from ops is okay, but capex/investing eats it all. Free cash flow? Barely.
9. Ratios – Sexy or Stressy?
| Ratio | Value |
|---|---|
| ROE | 2.3% |
| ROCE | 8.1% |
| D/E | 0.35 |
| P/E | 219 |
| PAT Margin | 0.4% |
Stressy. ROE barely registers; P/E screams overvaluation.
10. P&L Breakdown – Show Me the Money
| (₹ Cr) | FY23 | FY24 | FY25 |
|---|---|---|---|
| Revenue | 1,458 | 1,358 | 1,489 |
| EBITDA | 96 | 101 | 118 |
| PAT | 7 | 2 | 12 |
Growth? Only in stock price, not earnings.
11. Peer Comparison
| Company | Rev (₹ Cr) | PAT (₹ Cr) | P/E | ROE |
|---|---|---|---|---|
| KPR Mill | 6,388 | 797 | 51 | 17% |
| Vardhman | 9,862 | 852 | 16 | 9% |
| Welspun | 10,545 | 639 | 21 | 14% |
| AYM Syntex | 1,468 | 6 | 219 | 2% |
Looks like the intern in a room full of CEOs.
12. Miscellaneous – Shareholding, Promoters
- Promoter holding: 65.9%
- FIIs slightly up (3.8%) – maybe they like underdogs.
- Public: 30%
No dividends because profits are too shy to show up.
13. EduInvesting Verdict™
AYM Syntex has a decent product line and market, but profits are allergic to staying. The stock price reflects dreams, not numbers. A pit stop where investors need patience thicker than polyester yarn.
Written by EduInvesting Team | 26 July 2025
Tags: AYM Syntex, Polyester Yarn, Q1 FY26 Results, EduInvesting Premium

")


 Ltd (CDSL) Q1 FY26: “Where Your Shares Chill While You Panic-Sell”")
