1. At a Glance
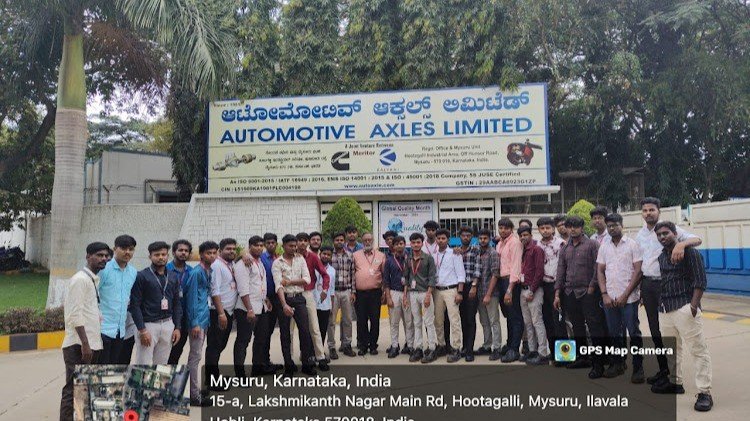
Automotive Axles Ltd is that kid in school who doesn’t talk much but aces every exam. Born in 1981 as a joint venture between Kalyani Group and Meritor Inc. (both holding 35.5%), it has quietly become thelargest independent axle manufacturerand thesecond-largest brake manufacturerin India. The company basically makes sure your trucks, buses, and off-highway monsters don’t collapse mid-journey. With Ashok Leyland accounting for nearly 57% of revenue (translation: “bro, please don’t break up with us”), the company sits on a healthy ROCE of 22% and barely any debt. But, as always, the devil hides in the quarterly numbers where growth sometimes feels like a Maruti 800 trying to overtake a Tesla.
2. Introduction
Let’s imagine a party where auto ancillaries are the guests. Bosch shows up in a tux, Uno Minda rolls in with champagne, and Automotive Axles walks in with… grease-stained hands and a torque wrench.
It doesn’t have the glamor of EV startups shouting “disruption” every five minutes, nor the swagger of Bharat Forge flexing its global footprint. But what Automotive Axles does have is good ol’boring profitability. And boring, my friends, is underrated.
Its bread-and-butter is making drive axles, front steer axles, brakes, and suspension systems. In other words, the parts that ensure a Tata truck doesn’t suddenly attempt a pole vault on Indian highways. The customer base is a who’s who of CV giants — Ashok Leyland, Tata Motors, Daimler India, Mahindra & Mahindra, and Volvo Eicher.
But here’s the kicker: while itdominatesrear drive axles with a 24% market share, the company’s fortunes are tied at the hip to cyclical truck demand. If truck sales slow, Automotive Axles feels it in the kneecaps faster than your WhatsApp family group gets fake news.
Still, the company isn’t sleeping on the job. It’s experimenting withEV axles(yes, e-axles for electric buses and trucks),Industry 4.0 smart assembly lines, and even solar investments. So while it may look like a grease monkey, it’s learning to speak “future-ready” in PowerPoint presentations.
3. Business Model (WTF Do They Even Do?)
Automotive Axles has asingle obsession: make axles and brakes, and make them well. Think of it as the orthopedic surgeon of the auto world — highly specialized, not flashy, but absolutely critical.
- Products:Drive axles, front steer axles, non-drive axles, drum and disc brakes, suspensions. Translation: the bones and joints of trucks and buses.
- Clients:Ashok Leyland (57% of FY21 revenue), Tata Motors, Daimler, Mahindra, Volvo Eicher. Basically, if India moves, chances are Automotive Axles has a hand in it.
- Facilities:Four plants (Mysore, Jamshedpur, Pantnagar, Hosur). Each one is
- a little axle factory that hums like a sewing machine.
- Aftermarket:They also do spares and servicing — the annuity-style cash that makes accountants smile.
- Innovation:Tandem axle, Solo HR axle, and an EV axle project in pipeline.
But here’s the twist: revenue concentration is high. If Ashok Leyland sneezes, Automotive Axles catches pneumonia. And unlike consumer brands, there’s no “axle loyalty” among truckers. If Tata decides to shift to another supplier, AAL can’t lure them back with a “limited edition axle with 5G.”
Still, the moat is manufacturing expertise, high entry barriers, and partnerships with global majors like Meritor (now part of Cummins). Think of it as an elite blacksmith guild that trucks can’t run without.
4. Financials Overview
Quarterly Snapshot (Q1 FY26):
| Metric | Latest Qtr (Jun’25) | YoY Qtr (Jun’24) | Prev Qtr (Mar’25) | YoY % | QoQ % |
|---|---|---|---|---|---|
| Revenue | ₹489 Cr | ₹492 Cr | ₹560 Cr | -0.6% | -12.7% |
| EBITDA | ₹57 Cr | ₹49 Cr | ₹63 Cr | +16.3% | -9.5% |
| PAT | ₹35.7 Cr | ₹34 Cr | ₹46 Cr | +5.0% | -22.4% |
| EPS (₹) | 23.6 | 22.5 | 30.4 | +5.0% | -22.3% |
Commentary:Revenue is stuck in neutral, EBITDA margin improved a bit (11.7%), but PAT QoQ fell harder than a pothole-ridden Mumbai road. Annualized EPS = ₹23.6 × 4 = ₹94.4. With CMP ~₹1,703, the recalculatedP/E = 18.0(not bad vs industry PE of 27.2).
5. Valuation (Fair Value Range)
We’ll do the three-idiots valuation method:
- P/E MethodAnnualized EPS: ₹94.4Apply conservative PE range (15x–22x):FV = ₹1,416 – ₹2,077
- EV/EBITDA MethodEBITDA FY25: ~₹219 CrEV/EBITDA range: 9x–12xFV = ₹1,971 – ₹2,628
- DCF (Simple)Free Cash Flow FY25: ~₹130 CrGrowth assumption: 8% CAGR for 5 yearsDiscount rate: 12%
