General information and entertainment, not investment advice. The author is not a SEBI-registered adviser or research analyst. No recommendation, no promised returns. Markets carry risk including loss of capital. Figures may not be current. Consult a registered adviser before acting.
1. At a Glance
Ashok Leyland recorded its best annual performance in the company’s history: ₹56,362 Cr revenue (+16% YoY), ₹3,471 Cr net profit (+12% YoY), and an EBITDA margin of 19.1%—the entry point into what management calls the “teen bracket.” The company shipped 220,437 CV units across trucks, buses, and defenses, surpassing the previous peak from FY19. Market share in M&HCV trucks stood at 30.2%, holding ground while the LCV segment saw share gains to 12.7% (up 80 bps).
The cash statement tells a different story: operating cash flow turned negative ₹4,895 Cr, a ₹11,136 Cr swing downward from FY25. The balance sheet expanded: borrowings grew to ₹63,936 Cr (+28% YoY), while cash edged up to ₹10,757 Cr. Net debt now sits at ₹53,178 Cr against a ₹14,242 Cr equity base.
Management highlighted a single profit center (Switch Mobility, the EV subsidiary) reaching profitability in FY26 and began groundbreaking on a ₹400–500 Cr battery pack plant. The question: does a 19% EBITDA margin fund a ₹1.2 Tr capex ladder while servicing ₹4.7 Cr annual interest?
2. Introduction
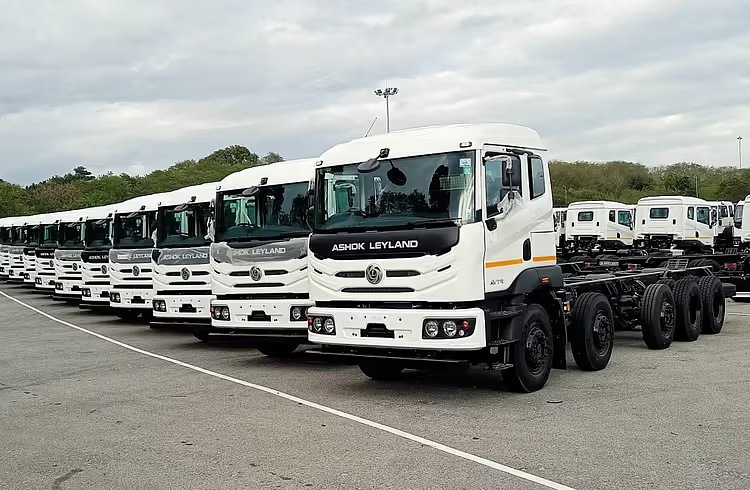
Ashok Leyland, the flagship of the Hinduja group, is India’s second-largest M&HCV manufacturer with near-pan-India reach and 50-country export footprint. The company has trained over 800,000 commercial vehicle drivers since inception, a detail revealing its ecosystem depth.
FY26 coincided with a reset in the domestic CV market: GST rate cuts on commercial vehicles (~10% reduction in listed prices) triggered a fleet-replacement cycle. The domestic MHCV industry grew 12% YoY; Ashok Leyland’s trucks grew faster in certain segments (LCV +12% YoY, exports +18.5%). The company added 100+ service touchpoints in MHCV and LCV each, bringing total network to 2,104 outlets—41% of new points in North and Northeast, a market-broadening move.
In May 2026, a change in financial leadership arrived: K M Balaji appointed Whole-Time Director and CFO. Days later, Gopal Mahadevan (Director, Strategic Finance and M&A) departed. By March 26, a groundbreaking for battery manufacturing was announced; by September 2025, an exclusive partnership with CALB (a Chinese battery maker) committed ₹5,000+ Cr over 7–10 years.
3. Business Model: WTF Do They Even Do?
Ashok Leyland is a vertically integrated, multi-product, multi-geography operation. Core CV manufacturing (89% of FY24 revenue) covers trucks (60% of mix), buses (12%), and light commercial vehicles (12%), with engines, gensets, and defense vehicles filling the remaining 16%.
The trucks business offers everything from 2.5-tonne light-hauls to 55-tonne articulated tippers, tractors, and specialized construction vehicles. Product realization jumped from ₹17.93 lakhs per unit in FY22 to ₹21 lakhs by FY24—a 17% uplift despite industry deflation, signaling mix toward premium axle configurations.
Buses are sold under brands: Cheetah, Viking, Lynx, Sunshine. In July 2024, a single order from Maharashtra State Road Transport Corporation (2,104 Viking units, ₹981 Cr) landed, illustrating order concentration risk and the narrow margin on bulk fleet sales.
Light commercial vehicles—3.5-tonne Bada Dost, smaller SGV carriers—expanded addressable market into agriculture and last-mile e-commerce. The aftermarket arm (689 outlets, AL Care app with 2.5L users) locks in customer lifetime value and is a genuine margin contributor at ₹3,800 Cr annual spares revenue.
Power Solutions (engines, gensets for industrial, marine, agri) recorded 32,374 engine sales in FY24, up 54% from FY22. Defense vehicles, a small absolute base (1,116 units in FY24, flat YoY), have a ₹1,500+ Cr order book and 20% annual growth guidance—indicating volume ramp ahead.
Switch Mobility, a subsidiary operating 950+ electric buses globally, reached net profitability in FY26. The EV bus market in India is tiny; the larger narrative is capex intensity and market immaturity. Switch also exports e-LCVs and claims market leadership in 2–4 ton segments. The phased battery strategy (pack → non-captive → cell) defers cell capex pending demand proof—disciplined, but also an admission of market uncertainty.
4. Financials Overview
Figures are consolidated, in ₹ crore.
| Metric | FY2026 | FY2025 | YoY Change |
|---|---|---|---|
| Revenue | 56,362 | 48,535 | +16.1% |
| EBITDA | 10,745 | 9,208 | +16.7% |
| Net Profit | 3,471 | 3,106 | +11.7% |
| EPS (annualised) | 5.91 | 5.29 | +11.7% |
The EBITDA margin of 19.1% (vs 19.0% in FY25) sits at a decade-high, per concall transcript. Management attributed this to “better price realizations, rigorous cost-saving efforts and favorable product mix.”
Material costs (raw materials, power, manufacturing overhead) as a ratio of revenue stood at 71.4% in Q4 FY26, up 80 bps YoY. The company conceded commodity pressure entering Q1 FY27, particularly in steel, but declined to quantify. Pricing actions of 1%–1.5% are being taken; management cautioned that sustaining these mid-quarter is uncertain if input inflation accelerates.
The cash conversion machinery seized in FY26: operating cash flow was ₹-4,895 Cr, a reversal of the ₹128 Cr generated in FY25. Management attributed this to working capital timing (“better to compare it with last year”) and typically high CV seasonality in Q3–Q4. Investing cash flow was ₹-7,016 Cr, a spike from ₹-5,759 Cr in FY25, as capex and subsidiary investments ramped. Financing activity—borrowings net of repayments—pumped in ₹11,617 Cr, offsetting the operational bleed and adding to the debt ladder.
5. Valuation Discussion: Fair Value Range (Educational Only)
What follows is a walkthrough of how three valuation methods work, using this company’s numbers as the example — not a target, not a forecast, not advice.
Method 1 (P/E Multiple): Annualised EPS is ₹5.91 (FY26 full-year basis). The peer band P/E ranges from 22.4x (Ashok Leyland’s current) to 34.5x (SML Mahindra’s) and 24.2x (Tata Motors). Taking a peer band of 22–28x and multiplying the annualised EPS ₹5.91 produces a range of ₹130–165 per share.
Method 2 (EV/EBITDA): Enterprise Value is ₹1,36,793 Cr (market cap of ₹83,614 Cr plus net debt of ₹53,179 Cr). EBITDA is ₹10,745 Cr, yielding an EV/EBITDA multiple of 12.7x. The peer band EV/EBITDA is 12.0x–30.9x (SML Mahindra). Applying the peer median 13–15x to FY26 EBITDA of ₹10,745 Cr produces ₹139,685–161,175 Cr enterprise value. Subtracting net debt of ₹53,179 Cr yields an equity value of ₹86,506–108,000 Cr, or ₹147–184 per share.
Method 3 (Simplified DCF – 5yr Horizon): Assuming a FY26 EBITDA of ₹10,745 Cr grows at 10% annually (below historical 5-yr growth of 23.7%), yields EBITDA of ₹17,263 Cr by FY31. Apply a 6.5x exit multiple (conservative for the peer set) yields ₹112,210 Cr enterprise value. Discounting at 8% WACC over 5 years and subtracting net debt yields a mid-point equity value range of ₹120–150 per share.
These figures show how the methods work and are not a valuation, a target, or advice.
6. What’s Cooking
Bus Order Book: Maharashtra State Road Transport Corporation awarded 2,104 Viking units in July 2024 for ₹981 Cr net. Similar large fleet orders followed from Tamil Nadu STU (1,937 units, ₹669 Cr in Oct 2025) and VRL Logistics (715 units, May 2026). These are volume drivers but thin-margin business; the company is bundling defense and aftermarket services to improve unit economics.
Defense Order Book: Stands at ₹1,500+ Cr and growing. Management expects 20% revenue growth in defense for 2–3 years. The fiscal ₹800 Cr in the consolidated books excludes certain subsidies; the true run-rate is closer to ₹1,200 Cr. Typical execution spreads are 1–3 years.
Battery & EV Capex: Groundbreaking on a ₹400–500 Cr pack facility at Pillaipakkam (Tamil Nadu) in March 2026; construction to start within 8–10 weeks, production targeted Q2 FY27. An exclusive partnership with CALB (Chinese battery maker) commits ₹5,000+ Cr over 7–10 years. Switch Mobility achieved net profitability (PAT ₹100+ Cr) in FY26 after years of burn.
New Product Launches: HIPPO tractors and TAURUS tippers with “industry’s best power and torque” shipped only a few hundred units by Mar 31 FY26; management expects visible share gains from Q2 FY27 onward (lead times, ramp-up). MAV trucks with improved powertrain 280 HV, Bada Dost 4.1-ton (LCV, best payload), and Phoenix (advanced LCV for export markets) are in early pipeline.
Capex Plan FY27: ₹750–1,000 Cr, focused on new products, alternate powertrains, and EVs. Switch India “comfortable” (implying reduced funding needs due to profitability); OHM Mobility (E-MaaS operator) and financing subsidiaries likely to require incremental support.
Reverse Merger in Finance: Hinduja Leyland Finance (HLF), AUM ₹59,000 Cr, PAT ₹491 Cr, will merge into NBL Ventures; expected closure within Q1 or Q2 FY27. Hinduja Housing Finance (HHF), AUM ₹16,000 Cr, PAT ₹387 Cr, remains standalone. Asset quality across both is tight (consolidated net NPA ~1.4%).
7. Balance Sheet: Liabilities & Assets
| Item | FY2026 | FY2025 | FY2024 |
|---|---|---|---|
| Equity Capital | 587 | 294 | 294 |
| Reserves | 13,654 | 11,938 | 8,711 |
| Net Worth | 14,242 | 12,232 | 9,005 |
| Borrowings | 63,936 | 49,962 | 40,802 |
| Other Liabilities | 22,863 | 19,352 | 17,788 |
| Total Liabilities | 101,041 | 81,546 | 67,595 |
| Net Block | 10,826 | 8,837 | 8,157 |
| CWIP | 549 | 577 | 415 |
| Investments | 7,467 | 6,610 | 2,329 |
| Other Assets | 82,199 | 65,523 | 56,695 |
| Total Assets | 101,041 | 81,546 | 67,595 |
Check: Assets = Liabilities in all three years. ✓
The balance sheet is a leverage tale. Borrowings jumped 28% in a single year; reserves grew 14%, absorption by net worth trailing sharply. The debt-to-equity ratio ballooned to 4.49x (from 4.08x in FY25, per Screener). Interest coverage (EBITDA ÷ Interest) is 2.28x—serviceable but narrow; a 10% margin erosion and EBITDA swings below ₹10,000 Cr would stress this metric.
Other Assets ballooned to ₹82,199 Cr, a catch-all for receivables, advances, and financial assets. Receivables (classic working capital) are ₹3,087 Cr with 20-day turnover. Inventory (₹4,672 Cr) turns every 50 days. The working capital cycle is actually negative (payables exceed receivables + inventory days), a sign the company collects cash before paying suppliers—a common strength in large fleet captive finance arms. Yet the cash conversion cycle in Q4 is tight, explaining the operating cash bleed.
Does the net cash buildup of ₹3,000+ Cr into Q3–Q4 from customer advances fix a 4.49x D/E ratio? No. A balance sheet with nothing to hide, a capital structure with a lot to defend.
8. Cash Flow: Sab Number Game Hai
| Year | Operating | Investing | Financing |
|---|---|---|---|
| FY2026 | -4,895 | -7,016 | 11,617 |
| FY2025 | 128 | -5,759 | 6,958 |
| FY2024 | -6,258 | 1,135 | 8,432 |
The tale: operating cash generation evaporated. A ₹256 Cr swing from FY25’s modest positive to a ₹4.9 Tr outflow in FY26 is attributed to Q3–Q4 seasonality and working capital timing (per management). But this occurs alongside net profit growth of 12%, signaling timing or working capital absorption, not operational failure.
Investing activity deepened (₹-7.0 Tr vs ₹-5.8 Tr), driven by capex ramp (₹1,050 Cr in FY26, vs plan ₹750–1,000 Cr for FY27) and subsidiary investments. The company repaid GBP 30 Cr (~₹375 Cr) of its GBP 80 Cr Optare (Switch UK) loan, reducing offshore cash bleed.
Financing activity injected ₹11.6 Tr net, nearly double the prior year—debt markets accommodating rising leverage. At current burn rates, the company is borrowing to fund capex and working capital swings, not operationally self-funding.
Wisdom: cash flow volatility this pronounced invites covenant scrutiny and narrows strategic optionality. A company that nets +3% profit margin but swings -9% in operating cash needs to address timing or structural working-capital headwinds.
9. Ratios: Sexy or Stressy?
| Ratio | FY2026 | Peer Median |
|---|---|---|
| ROE | 24.37% | 31.77% |
| ROCE | 13.82% | 13.82% |
| P/E | 24.03x | 26.75x |
| OPM (EBITDA ÷ Sales) | 19.06% | 11.09% |
| D/E | 4.49x | 8.22x |
ROE at 24.37% reflects the company’s ability to generate profit from shareholder capital, though this is inflated by financial leverage; the raw return on assets (ROA) is just 4.37%, meaning the operating machine is modest. ROCE at 13.82% matches the peer median, confirming that capital productivity is in-line, not exceptional. The ₹10.8 Tr net block supporting ₹3.5 Tr in profit is capital-light for manufacturing, a structural advantage.
The OPM of 19.06% is the headline draw: the company runs margins 70% above the peer average (11.09%). But OPM ≠ take-home; the net margin (NPM) is 6.16%, below the peer median of 6.14% in absolute terms but with higher asset leverage. An OPM this wide is sustainable only if cost discipline holds and pricing power doesn’t erode.
P/E at 24.03x is slightly below the peer median (26.75x), appearing “cheaper.” The market is pricing the company at a small discount to peers, possibly reflecting debt and capex execution risk.
D/E at 4.49x is lower than the peer median 8.22x—a statistical outlier suggesting the peer set (which includes highly leveraged auto financial subsidiaries) skews high. Still, 4.49x is aggressive for a manufacturing cyclical; a downturn of 15–20% in earnings would push this into covenant anxiety territory.
10. P&L Breakdown: Show Me the Money
| Year | Revenue | EBITDA | Net Profit |
|---|---|---|---|
| FY2026 | 56,362 | 10,745 | 3,471 |
| FY2025 | 48,535 | 9,208 | 3,107 |
| FY2024 | 45,703 | 7,856 | 2,484 |
Revenue grew 16% (FY26 vs FY25), EBITDA 17%, and net profit 12%. The margin trajectory is one of gradual compression through the tax and finance layers: EBITDA margin of 19.1% drains to an NPM of 6.2% after depreciation (₹1,138 Cr), interest (₹4,705 Cr), and taxes (₹1,434 Cr). The ₹4.7 Cr annual interest burden is the single largest pressure point. Each 100-bps rise in borrowing costs (₹64 Cr higher interest) would shave ₹46 Cr net profit (1.3% of FY26).
FY24–FY26, the company ramped volumes 23% while margins widened. Volume leverage is evident: every incremental rupee of revenue drops into a higher EBITDA margin than the base, a characteristic of CV manufacturers exiting cyclical downturns (FY20–FY22 were depressed). The margin expansion from 17.1% in FY24 to 19.1% in FY26 is real, but it also reflects an unusually benign commodity environment (before the steel spike signaled into Q1 FY27).
11. Peer Comparison
| Company | Revenue (Cr) | Net Profit (Cr) | P/E | OPM |
|---|---|---|---|---|
| Tata Motors | 83,855 | 5,529 | 24.2x | 11.97% |
| Ashok Leyland | 56,362 | 3,471 | 24.03x | 19.06% |
| SML Mahindra | 2,838 | 160 | 34.52x | 9.81% |
| Atul Auto | 824 | 43 | 29.29x | 10.20% |
Tata Motors dwarfs the peer set in absolute scale; it’s a multi-segment conglomerate (CVs, PVs, EVs, engineering). Ashok Leyland is the pure-play CV specialist at ₹56k Cr revenue—second only to Tata in segment revenue. SML Mahindra and Atul Auto are niche players, much smaller in scale.
The margin gap is stark: Ashok Leyland’s 19.06% OPM sits 70% above Tata’s (11.97%) and double the others’. This reflects Ashok Leyland’s focus on higher-margin M&HCV segment and scale in bus manufacturing. Yet on profitability per rupee of capital, Ashok Leyland’s ROCE (13.82%) exactly matches the peer median, meaning capital intensity, not operational excellence alone, is behind the margin advantage.
Valuation multiples converge: Ashok Leyland at 24.03x is trading inline with Tata (24.22x), suggesting the market views CV demand and margin sustainability as symmetric across the two largest players. SML trades at a premium (34.52x), reflecting smaller size and boutique status; Atul at 29.29x, a mid-range premium.
12. Miscellaneous: Shareholding & Promoters
| Holder | % of Shares |
|---|---|
| Promoters (Hinduja Group) | 51.51% |
| Foreign Institutional Investors | 24.57% |
| Domestic Institutions | 13.06% |
| Public | 10.79% |
| Government | 0.07% |
The Hinduja Group, through Hinduja Automotive Limited (34.99%), JP Morgan Chase Bank (11.30% as a custodian holding for Hinduja Bank Switzerland), and related entities, commands 51.51% of equity. A 40.1% pledge of promoter holding (per Screener) means a large chunk of their stake is in hock to lenders, a common practice for family offices to finance expansion or subsidiary ventures. Pledge history is secondary to control; pledges become newsworthy only if redemption slips.
Hinduja Group companies are old-economy Tier-1 conglomerates with a track record spanning infrastructure, power, and automobiles. The group has a reputation for operational rigor in capital-intensive businesses. Cross-group funding (Hinduja Leyland Finance’s ₹59k Cr AUM, Hinduja Housing’s ₹16k Cr AUM) creates a tightly coupled ecosystem, amplifying group-level leverage risk.
FII buying crept in: 24.57% in Jun 2026 vs 16.59% in Jun 2023, a 8-percentage-point gain. DII holding fell from 20.79% to 13.06% over the same period—domestic funds rotating out. This pattern (FII accumulation + DII reduction) suggests global funds are comfortable with CV cyclicality and India’s medium-term demand; domestic funds are reassessing at these valuations.
13. Corporate Governance: Angels or Devils?
Auditors: ICRA ratings reaffirmed all instruments in June 2026: AA+ (Stable) on NCDs and fund-based facilities, A1+ on commercial paper. A Stable outlook indicates credit stability expectations over the next 12–24 months.
Board & Management: In May 2026, K M Balaji took over as Whole-Time Director and CFO (2-year contract), replacing the prior incumbent. Gopal Mahadevan (Director, Strategic Finance) exited in late May. Dr. Gayatri Vyas Dadheech was appointed President of Battery Business in March 2026. Alfred Nixon Mendez joined as Head of Product Development (Jan 2026); Dr. Saravanan shifted to strategic CTO. Jasmeet Bhatia became President & HR (Jan 2026).
The management churn is notable: a CFO change in the midst of heavy capex and EV investment shifts signals either a boardroom recalibration or a transition for growth. New CFO arrivals typically herald tighter cost discipline or strategic shifts. The battery and product development appointments align with the stated EV and premiumization strategy.
Related-Party & Tax: No material red flags in FY26 filings. The reverse merger of Hinduja Leyland Finance into NBL Ventures (Novation Developments Pvt Ltd) is an internal group consolidation, awaiting regulatory approvals; expected closure within Q1–Q2 FY27.
Pledges & Contingencies: 40.1% of promoter shares pledged (noted above). No material contingent liabilities reported. The company is rated AA+ by both ICRA and CARE, indicating low default risk on term debt.
14. Industry Roast & Macro Context
The domestic CV market is a margin-compression deathmatch. The GST rate rationalization of ~10% in FY26 triggered a fleet-replacement cycle, boosting volumes 12% YoY at the sector level. But price cuts are permanent; volume upside is cyclical. The profit pools are shifting toward specialized segments: mining-linked tippers and multi-axles (growing fastest per management); long-haul tractor-trailers and ICV (segment saturation) softening.
Diesel availability hiccups and uncertainty over pricing are endemic to the sector. Management waved away diesel anxiety as “manageable” and “not impacting fleet replacement plans over 12–18 months.” But the 12–18-month window is narrow; a sharp, sustained diesel price shock historically derails CV demand (example: FY20, when GST implementation + commodity shock imploded CV volumes).
Competition is stiff: Tata Motors, Mahindra & Mahindra, Eicher Motors, and a dozen mid-tier players (Swaraj, Force, etc.) segment the market by price, capability, and geography. Ashok Leyland’s 30% M&HCV market share is strong but stable, not expanding. New product launches (HIPPO, TAURUS) are meant to defend share in premiums segments, not capture additional market.
International logistics disruptions (noted in Q4 FY26 export slowdown) reflect supply-chain fragility. A ₹3,200 Cr export revenue (5.7% of total) on a global installed base of 950+ buses is nascent; geographic diversification is years away.
The sector itself is maturing: fleet ages are at all-time highs (driver of replacement), but new-registrations growth is slowing. EV penetration in buses is rising but remains small (estimated <10% of annual bus sales nationally). Ashok Leyland’s bet on Switch Mobility and battery manufacturing is a rational hedge, but profitability on EVs remains unproven.
15. EduInvesting Verdict
| Strengths | Weaknesses |
|---|---|
| 19.1% EBITDA margin, 70% above peer average; market leadership in M&HCV trucks (30%) and buses (34%) | ₹63,936 Cr borrowings; D/E of 4.49x; interest burden of ₹4.7 Cr annually; operating cash flow negative ₹4.9 Cr in FY26 |
| Revenue & profit CAGR (5-yr) of 24% and 85%, respectively; volume growth to all-time highs; LCV share expanding | Margin sustainability contingent on benign commodity costs and pricing discipline; FY27 steel inflation already signaled; new product ramp timing uncertain |
| Hedged by aftermarket (₹3.8 Cr spares), defense (₹1.5+ Cr order book, 20% growth), and EV transition (Switch India profitable in FY26) | Capital allocation to ₹5k Cr battery strategy + ₹1.2 Tr capex ladder while servicing ₹4.7 Cr interest; execution risk on EV profitability and market adoption |
| Strong brand, 50-country footprint, well-integrated distribution, 2,104 service outlets, driver training ecosystem | Leadership churn (CFO, Strategic Finance, General Counsel exits); battery technology tied to CALB (Chinese partner), not proprietary |
Closing Observation: A company entering its “teen margin” decade, commanding half the M&HCV truck market and leading in buses, yet borrowing at a pace that swallows free cash flow and locks capital allocation to an EV bet whose profitability remains theoretical. The balance sheet confidence required to sustain ₹1.2 Tr capex is high; a margin shock of 200–300 bps or a volume miss of 10–15% would test covenant headroom. The stock, at 24x P/E, prices in execution—both margin defense and the EV transition. The margin, not the multiple, is the real point of tension.
