1. At a Glance – The ICU Monitor Is Beeping Green
Apollo Hospitals Enterprise Ltd is trading at ₹7,550 with a market cap of ₹1,08,557 crore. In the last 3 months, the stock moved a polite 1.6% — basically the share price is walking, not running. Meanwhile, Q3 FY26 numbers show consolidated revenue of ₹6,477 crore and PAT of ₹516 crore, with operating margin at 15%. That’s a 17.2% YoY sales growth and 38.7% YoY profit growth. Sounds healthy, right?
But here’s the spicy part — the stock trades at 59.8x earnings, 12x book value, and an EV/EBITDA of 30.5. Dividend yield? A modest 0.25%.
ROE stands at 18.4%, ROCE at 16.6%, and debt at ₹7,987 crore.
So the question is simple: Are we paying for a hospital business… or for India’s largest digital pharmacy super app plus a proton therapy sci-fi machine?
Grab your stethoscope. Let’s examine the patient.
2. Introduction – From One Hospital to Healthcare Empire
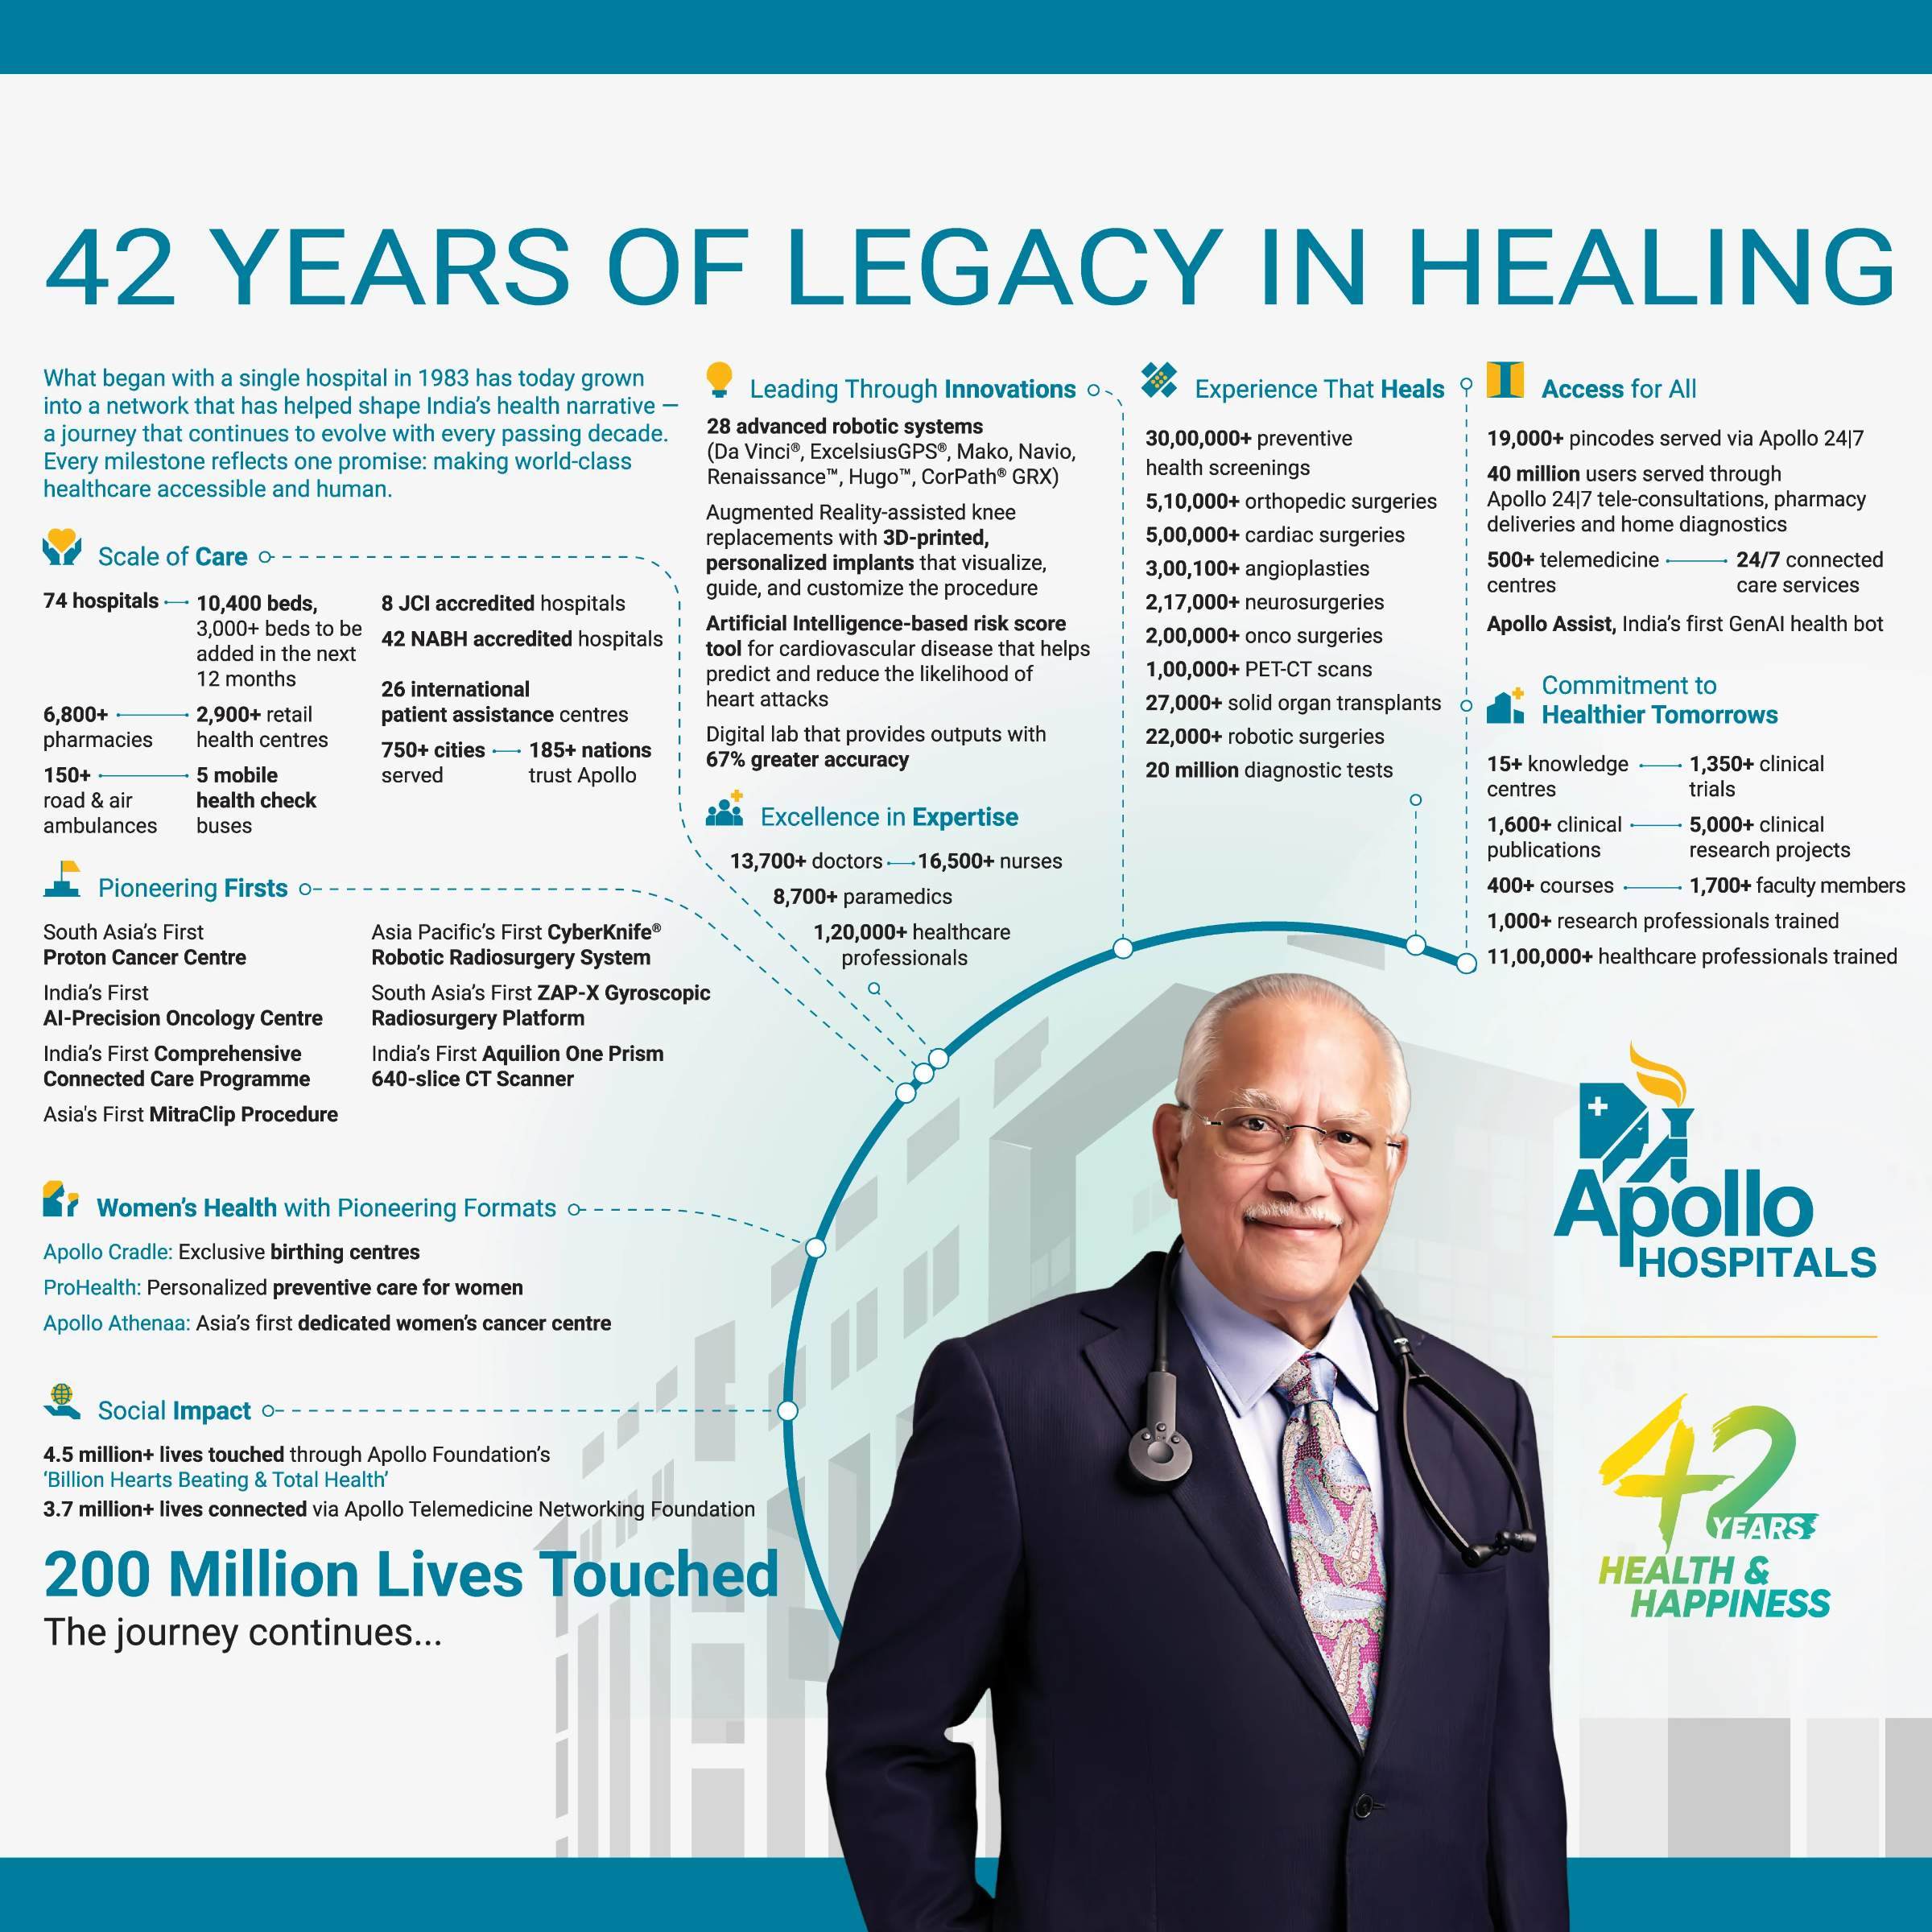
Founded in 1983 by Dr. Prathap C Reddy, Apollo was India’s first corporate hospital. Back then, the idea of a “corporate hospital” probably sounded like a five-star hotel with IV drips. Today, it’s a 73-hospital behemoth with 10,200 beds.
But Apollo isn’t just about hospitals anymore.
It’s a healthcare ecosystem:
- Hospitals
- Pharmacies
- Diagnostics
- Dialysis centers
- Dental clinics
- Online consultations
- Insurance tie-ups
- And now, demergers and mergers that sound like a Netflix business thriller.
In H1 FY26:
- Healthcare Services = 50% of revenue
- Digital Health & Pharmacy = 42%
- Retail Health & Diagnostics = 8%
Translation? This is no longer just a hospital company. It’s a healthcare conglomerate pretending to be a hospital stock.
And investors are clearly pricing it like a tech-enabled health infrastructure giant.
But is the performance matching the premium? Or are we paying MRI prices for X-ray returns?
Let’s dissect.
3. Business Model – WTF Do They Even Do?
Apollo operates like a three-headed hydra.
1) Healthcare Services (Core Hospitals – 50%)
10,200 beds across 73 hospitals.
Bed occupancy: 67% in H1 FY26.
Average Revenue Per Patient (Inpatient): ₹1,72,819.
Specialty mix:
- Cardiology: 19%
- Oncology: 17%
- Neurology: 10%
- Orthopaedics: 10%
Insurance payor mix:
- Insurance: 45%
- Self Pay: 41%
This is high-end tertiary and quaternary care. They are not doing cough-and-cold OPDs. They are doing robotic